Data Integration
In this post we will show how to use knowledge graph to integrate data of different data types from multiple data sources.We will integrate the following datasets:
- Kaggle dataset that we used in the previous two posts: 'Museum of Modern Art Collection'.
- Data from MoMA exhibition: 'Inventing Abstraction 1910-1925'
- Data about a timeline of the 'Modern Art Movements'
Museum of Modern Art Collection
Data in Museum of Modern Art Collection has information about artists, there biographies and there paintings. In two previous posts based on this data we demonstrated how to use Knowledge Graph for data mining and semantics.In the 'Knowledge Graph for Data Mining' post we created Artist Biography knowledge graph connecting artist names with their nationalities, countries where they were born, genders and life years. This knowledge graph allowed us to find different groups of artists, for example artists that were born in the same country or artists that changed their nationalities. We will start data integration from the Artist Biography knowledge graph nodes and edges:
val artistBioNodes = sqlContext.read.parquet("graphNodesArtistBio")
val artistBioEdges = sqlContext.read.parquet("graphEdgesArtistBio")
val artistBioGraph=GraphFrame(artistBioNodes, artistBioEdges)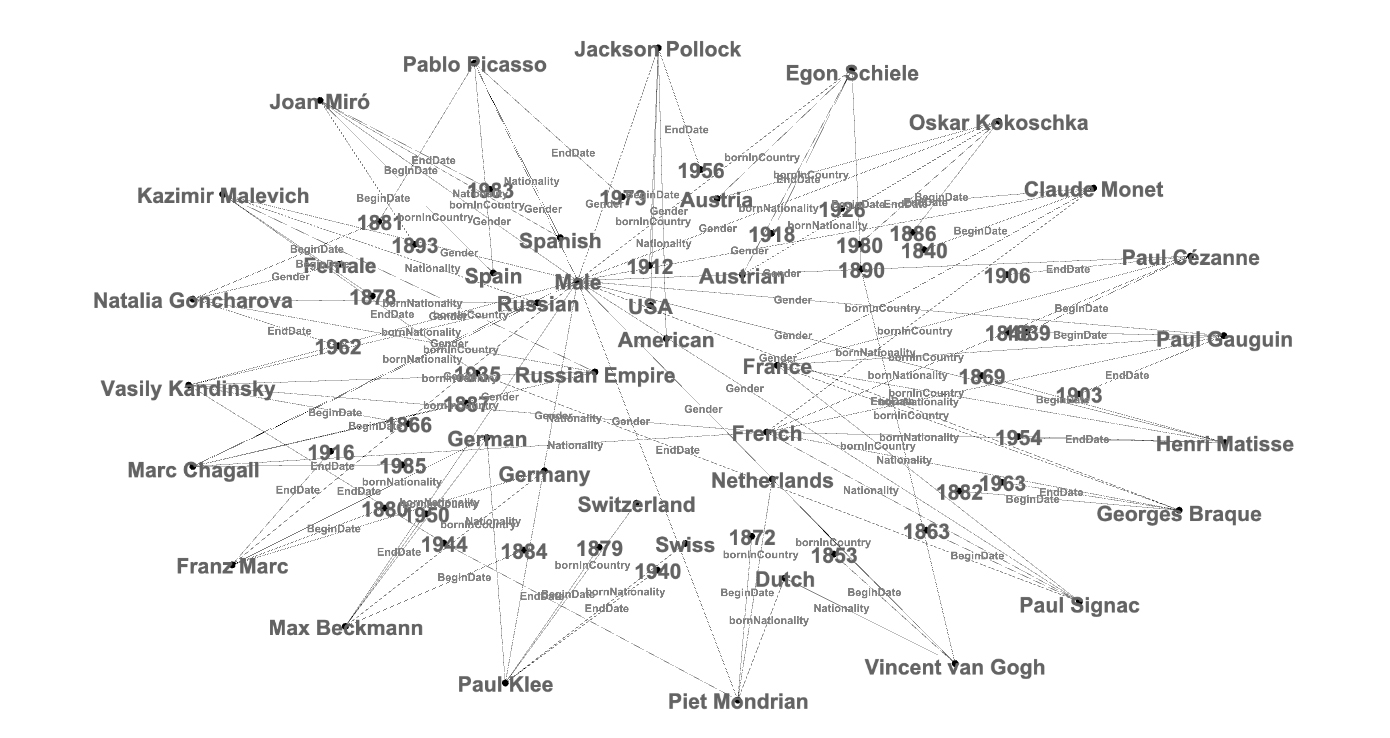 This graph is artist name centric:
val bioArtistList=artistBioGraph.edges.select("src").distinct
display(bioArtistList.orderBy("src"))
Claude Monet
Egon Schiele
Franz Marc
Georges Braque
Henri Matisse
Jackson Pollock
Joan Miró
Kazimir Malevich
Marc Chagall
Max Beckmann
Natalia Goncharova
Oskar Kokoschka
Pablo Picasso
Paul Cézanne
Paul Gauguin
Paul Klee
Paul Signac
Piet Mondrian
Vasily Kandinsky
Vincent van Goghdisplay(artistBioEdges.select("edgeId").distinct.orderBy('edgeId))
BeginDate
EndDate
Gender
Nationality
bornInCountry
bornNationalityimport org.apache.spark.sql.expressions.Window
val partitionWindow = Window.partitionBy($"edgeId").orderBy($"dst")
display(artistBioEdges.select("dst","edgeId").distinct.
withColumn("rn",row_number().over(partitionWindow)).
filter("rn<4").orderBy('edgeId,'rn))
1839,BeginDate,1
1840,BeginDate,2
1848,BeginDate,3
1890,EndDate,1
1903,EndDate,2
1906,EndDate,3
Female,Gender,1
Male,Gender,2
American,Nationality,1
Austrian,Nationality,2
Dutch,Nationality,3
Austria,bornInCountry,1
France,bornInCountry,2
Germany,bornInCountry,3
American,bornNationality,1
Austrian,bornNationality,2
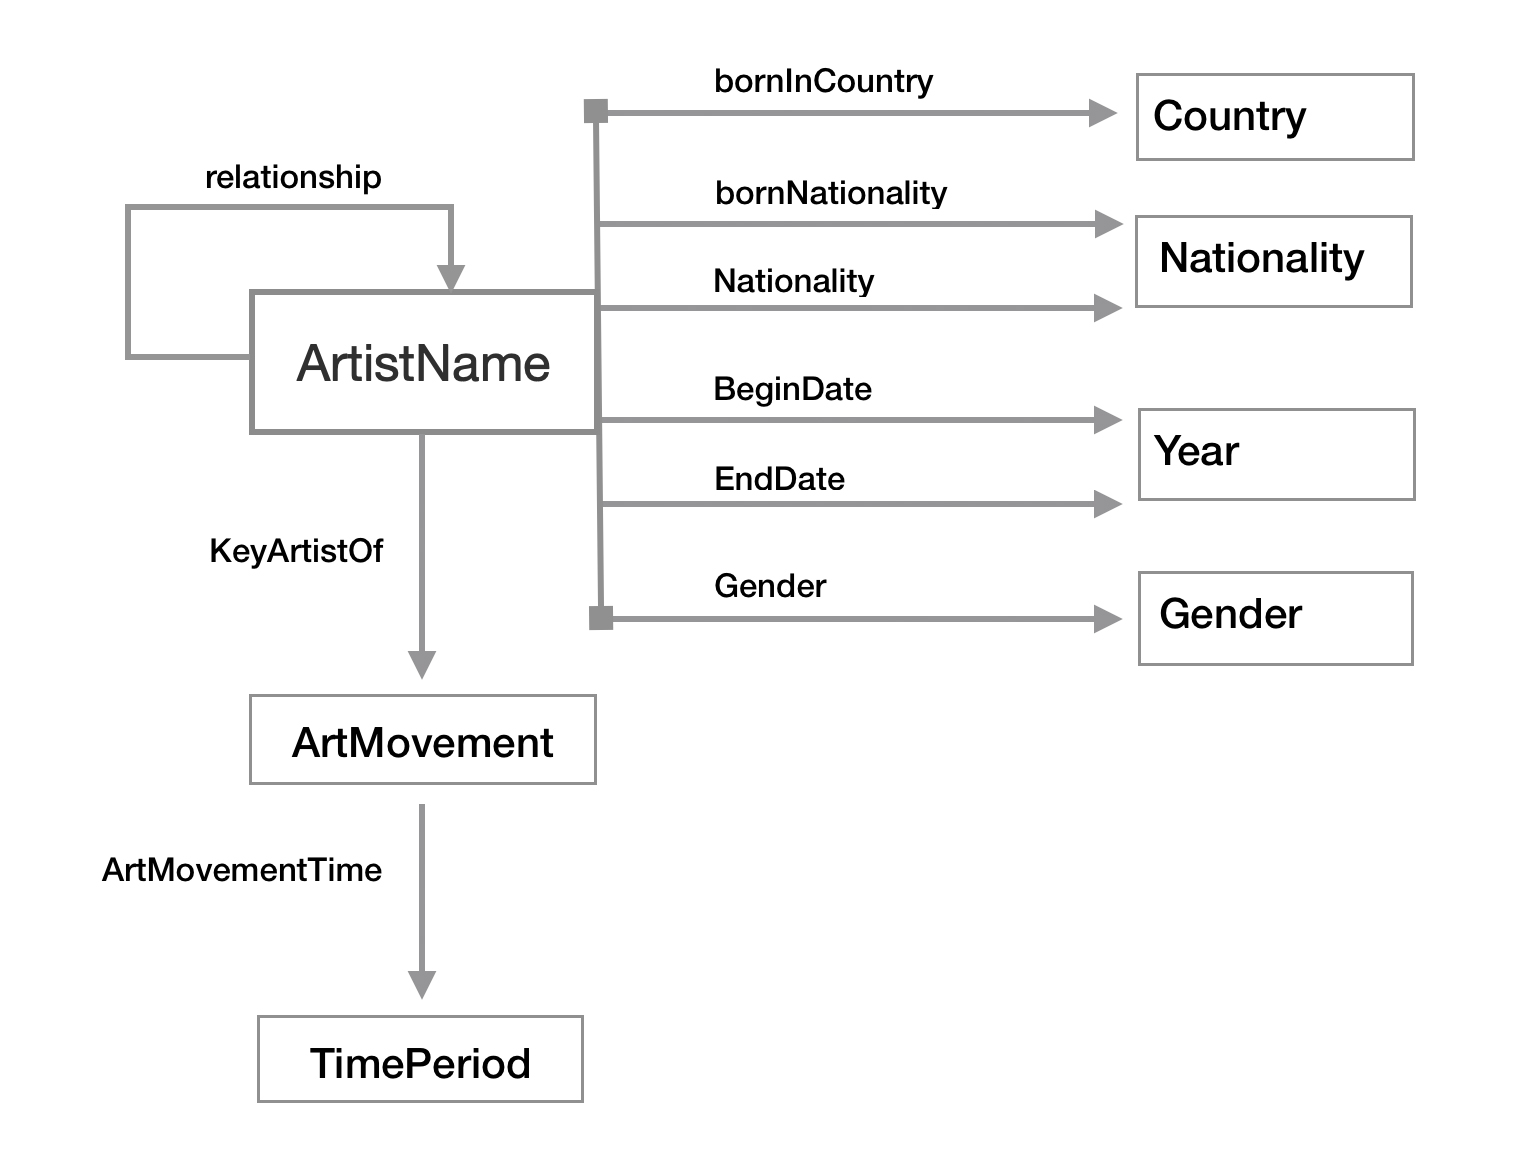
Dutch,bornNationality,3val artistBioOntoEdged=sc.parallelize(Array(
("Year","BeginDate"),("Year","EndDate"),
("Gender","Gender"),("Nationality","Nationality"),
("Nationality","bornNationality"),("Country","bornInCountry"))).
toDF("dst","edgeId").withColumn("src",lit("ArtistName"))val artistBioOntoGraph=GraphFrame(
artistBioOntoEdged.select("src").
union(artistBioOntoEdged.select("dst")).
distinct.toDF("id"),
artistBioOntoEdged.distinct)display(graph2dot(artistBioOntoGraph))
"Year" -> "EndDate" [label="ArtistName"];
"Nationality" -> "Nationality" [label="ArtistName"];
"Year" -> "BeginDate" [label="ArtistName"];
"Nationality" -> "bornNationality" [label="ArtistName"];
"Country" -> "bornInCountry" [label="ArtistName"];
"Gender" -> "Gender" [label="ArtistName"];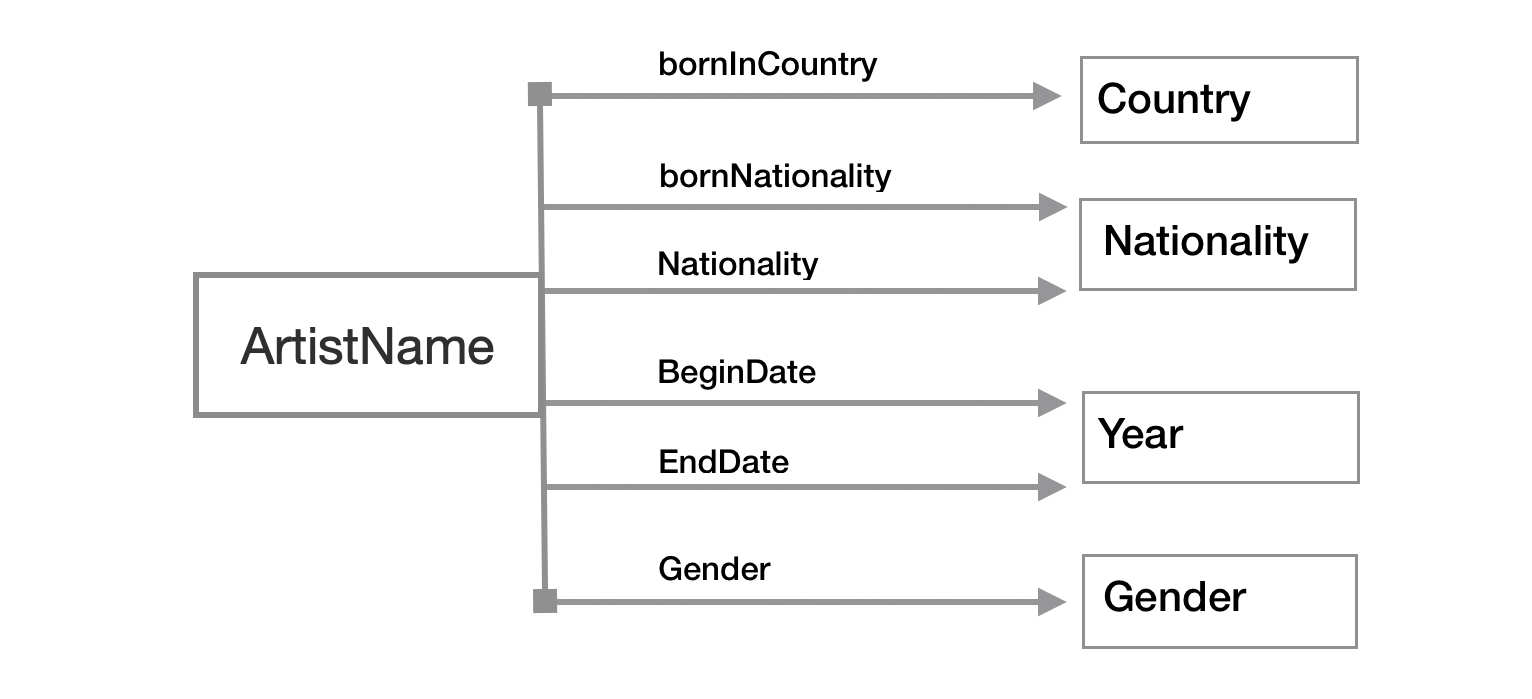
"Inventing Abstraction 1910-1925" MoMA Exhibition Data
As the next set of data we will use data from MoMA exhibition "Inventing Abstraction 1910-1925"
presented many abstraction artists.
The following artists from our Artist Biography knowledge graph were presented on that exhibition:
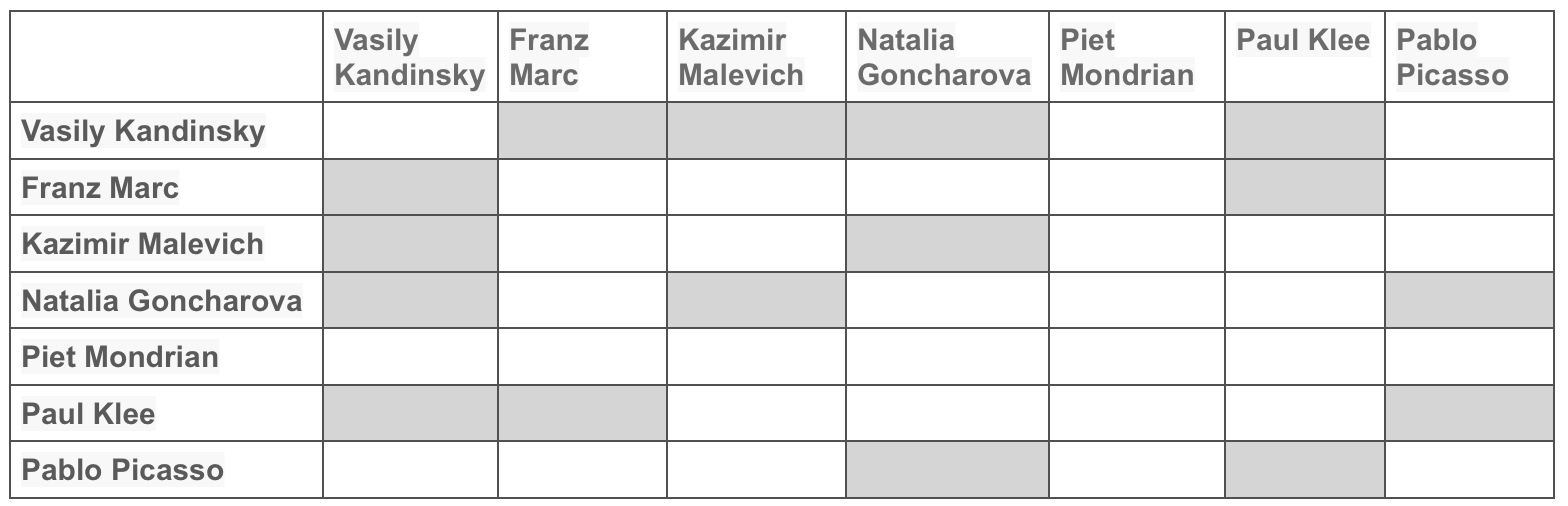 Connections between artist pairs:
val artistPairsDF=sc.parallelize(Array(
  ("Vasily Kandinsky","Franz Marc"),
  ("Vasily Kandinsky","Kazimir Malevich"),
  ("Vasily Kandinsky","Natalia Goncharova"),
  ("Vasily Kandinsky","Paul Klee"),
  ("Franz Marc","Paul Klee"),
  ("Kazimir Malevich","Natalia Goncharova"),
  ("Natalia Goncharova","Pablo Picasso"),
  ("Paul Klee","Pablo Picasso"))).
toDF("col1","col2")val artistPairEdges=artistPairsDF.
union(artistPairsDF.select("col2","col1")).toDF("src","dst").
withColumn("edgeId",lit("relationship"))val artistPairGraph=GraphFrame(
artistPairEdges.select("src").
union(artistPairEdges.select("dst")).distinct.toDF("id"),
artistPairEdges.distinct)display(graph2dot(artistPairGraph))
"Franz Marc" -> "Vasily Kandinsky" [label="relationship"];
"Vasily Kandinsky" -> "Natalia Goncharova" [label="relationship"];
"Natalia Goncharova" -> "Vasily Kandinsky" [label="relationship"];
"Vasily Kandinsky" -> "Franz Marc" [label="relationship"];
"Vasily Kandinsky" -> "Kazimir Malevich" [label="relationship"];
"Paul Klee" -> "Vasily Kandinsky" [label="relationship"];
"Paul Klee" -> "Franz Marc" [label="relationship"];
"Paul Klee" -> "Pablo Picasso" [label="relationship"];
"Natalia Goncharova" -> "Pablo Picasso" [label="relationship"];
"Franz Marc" -> "Paul Klee" [label="relationship"];
"Natalia Goncharova" -> "Kazimir Malevich" [label="relationship"];
"Pablo Picasso" -> "Paul Klee" [label="relationship"];
"Kazimir Malevich" -> "Natalia Goncharova" [label="relationship"];
"Vasily Kandinsky" -> "Paul Klee" [label="relationship"];
"Kazimir Malevich" -> "Vasily Kandinsky" [label="relationship"];
"Pablo Picasso" -> "Natalia Goncharova" [label="relationship"];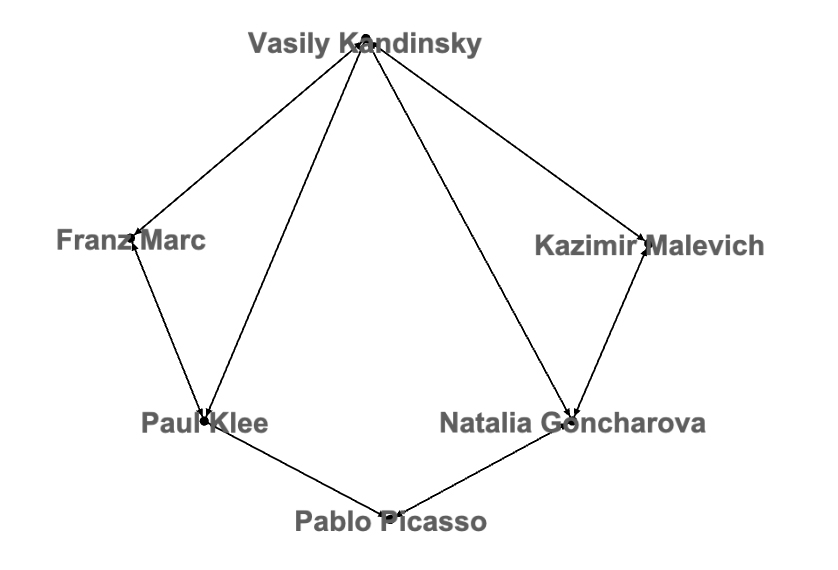 Ontology:
"ArtistName" -> "ArtistName" [label="relationship"];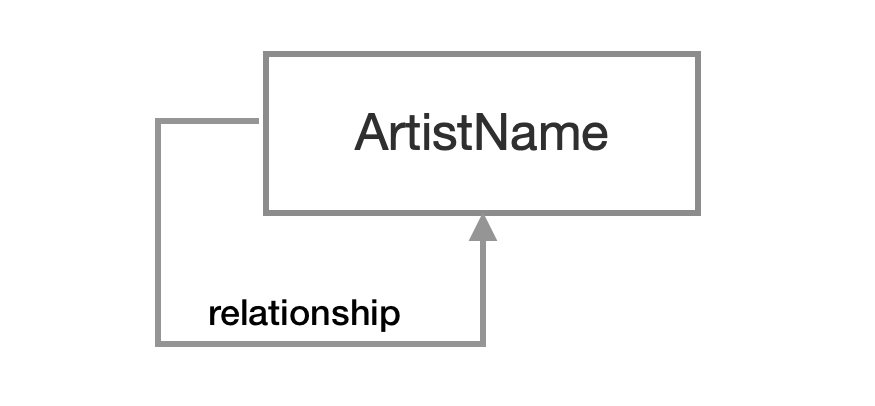
Integrate Artist Biography knowledge graph with artists' relationships
Metadata integration
Ontology of integrated graph: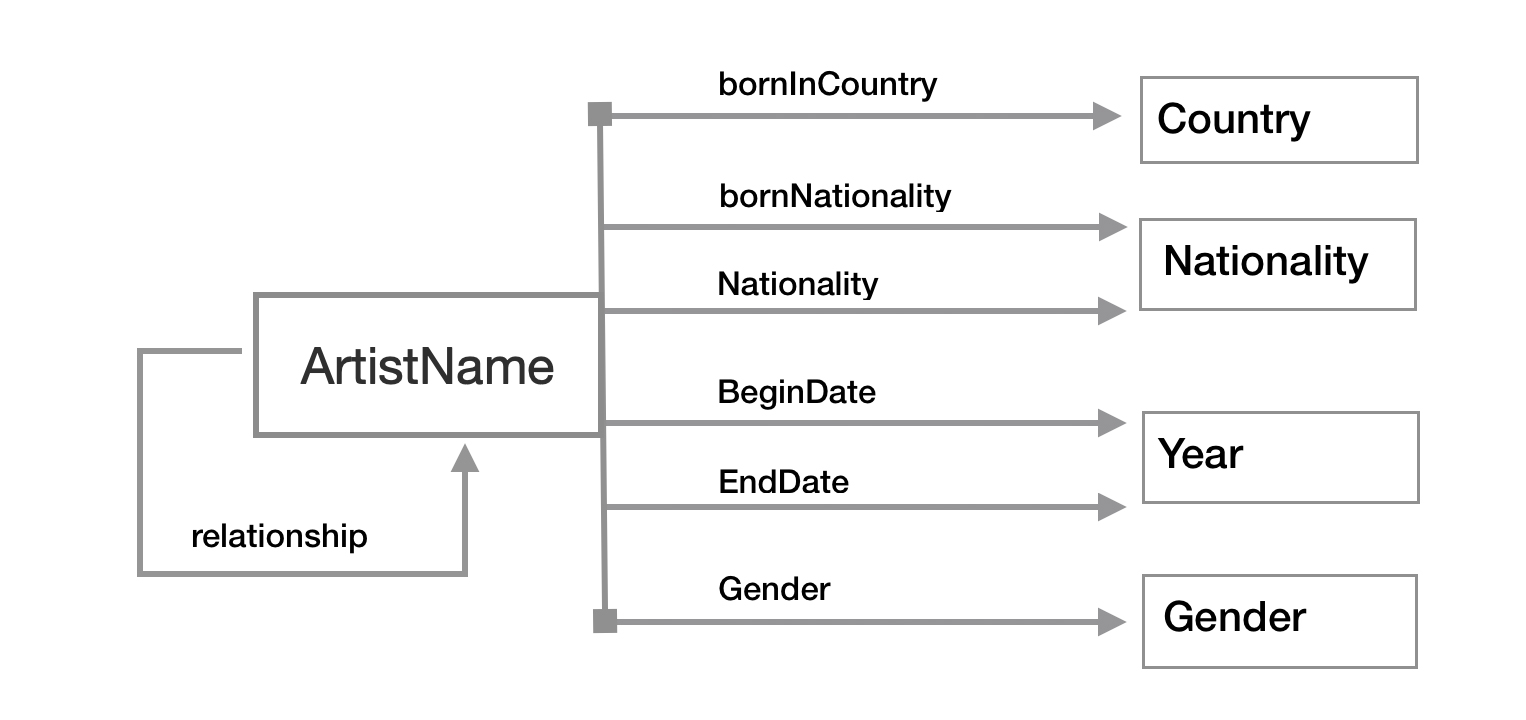
Data integration
There are two ways to integrate Artist Biography knowledge graph with Artists Pairs knowledge graph:- Add Artists Pairs edges to Artist Biography edges
- Overlap Artists Pairs nodes with Artist Biography nodes
val unionArtistPairBioEdges=artistPairGraph.edges.
  union(artistBioGraph.edges)
val unionArtistPairBioGraph=GraphFrame(
  unionArtistPairBioEdges.select("src").
  union(unionArtistPairBioEdges.select("dst")).distinct.toDF("id"),
unionArtistPairBioEdges.distinct)val overlapArtistPairBioEdges=artistBioGraph.edges.
join(artistPairGraph.vertices,'src==='id || 'dst==='id).
select("src","dst","edgeId").union(artistPairGraph.edges)
val overlapArtistPairBioGraph=GraphFrame(
overlapArtistPairBioEdges.select("src").
union(overlapArtistPairBioEdges.select("dst")).distinct.toDF("id"),
overlapArtistPairBioEdges.distinct) 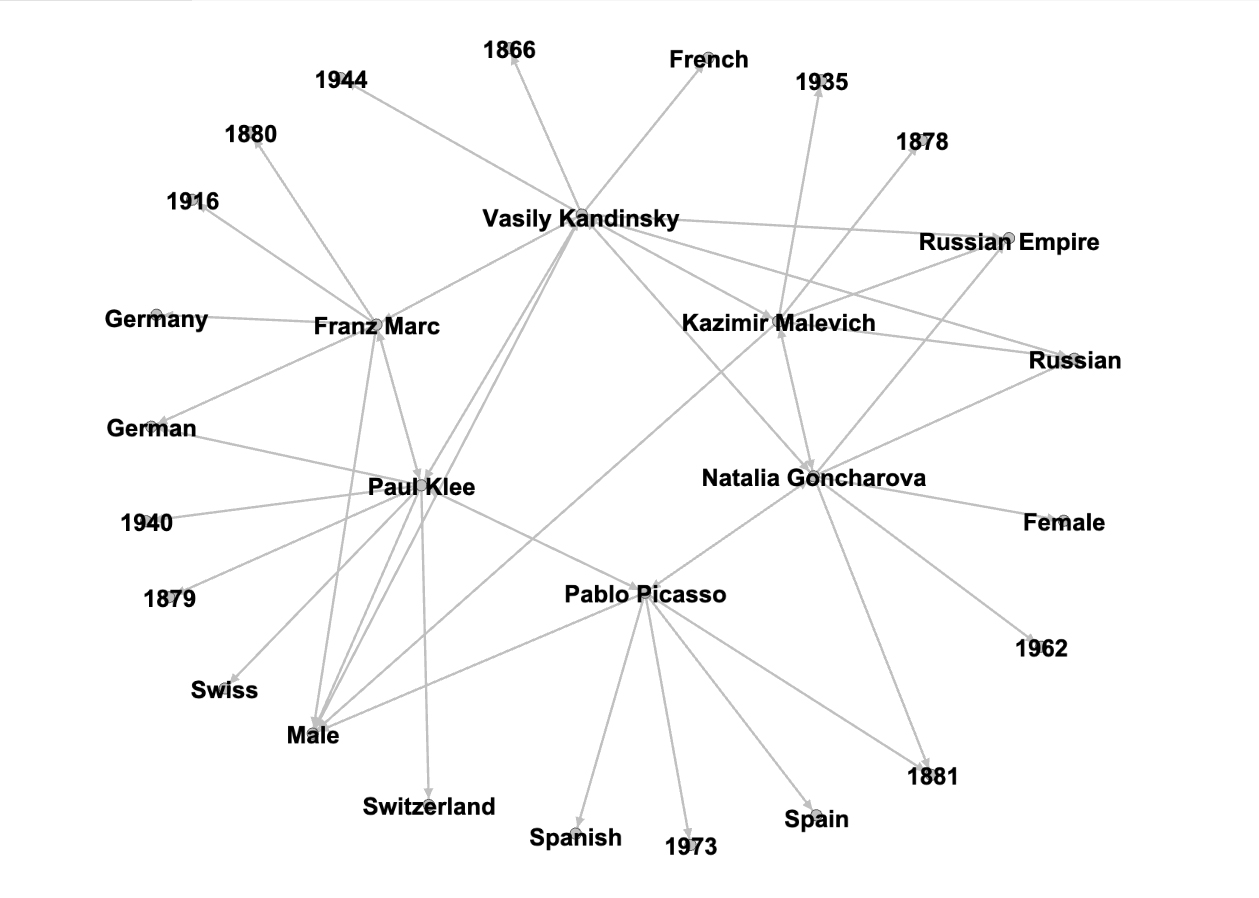
Modern Art Movements Timeline Data
Our next dataset is data about a timeline of the Modern Art Movements:display(sc.textFile("/FileStore/tables/aboutModerArt").toDF("charLine"))Impressionism
Summary: Masters of color and light. Marked a radical departure from the realistic academic painting that had dominated the eras prior.
"Key artists: Claude Monet, Pierre-Auguste Renoir, Camille Pissarro, Edgar Degas, Edouard Manet, Mary Cassatt"
"""When you go out to paint try to forget what object you have before you - a tree, a house, a field or whatever. Merely think, here is a little square of blue, here an oblong of pink, here a streak of yellow, and paint it just as it looks to you, the exact color and shape, until it emerges as your own naive impression of the scene before you."" Claude Monet"Early 1880s - 1914
Post-Impressionism
"Summary: Emphasis on symbolic content and the artist's interpretation of the world. Post-impressionism shared many of the characteristics of Impressionism such as the use of vivid colors, expressive brushwork and everyday subjects. But there seemed to be a focus on distorted forms, geometric shapes and unnaturalistic colors to depict emotions and feelings. Artists often used the pointillism technique, which involved placing small dabs of distinct color."
"Key artists: Paul Cézanne (the ""father of Post-Impressionism""), Vincent Van Gogh, Paul Gauguin, Georges-Pierre Seurat, Paul Signac"
"""I dream of painting and then I paint my dream."" Vincent van Gogh" 1907 – 1922
Cubism
"Summary: Focused on abstraction and geometric shapes, rather than space, perspective and realistic rendering."
"Key artists: Pablo Picasso, Georges Braque, Juan Gris, Fernand Léger"
"""Cubism is not a reality you can take in your hand. It's more like a perfume, in front of you, behind you, to the sides, the scent is everywhere but you don't quite know where it comes from."" Pablo Picasso" 1924-1966
Surrealism
"Summary: Depicted dreams, fantasies and the unconscious state. Often incorporated the juxtaposition of incompatible elements."
"Key artists: Joan Miró, Salvador Dalí, René Magritte, André Breton, Yves Tanguy, Frida Kahlo, Max Ernst, Méret Oppenheim"
"""Surrealism is destructive, but it destroys only what it considers to be shackles limiting our vision."" Salvador Dalí" To convert this data to DataFrame we will do the following:
- Index data by zipping text lines with range from 0 to 84
- Transform to DataFrame (index, line)
- Calculate reminder index%5 - add a column "rem"
- Calculate deviser index/5- add a column "div"
import org.apache.spark.sql.functions._
val data=(Seq.range(0,85) zip
  sc.textFile("/FileStore/tables/aboutModerArt").collect).
  toDF("inx","charLine").withColumn("rem",col("inx")%5).
  withColumn("div",floor(col("inx")/5))
display(data)
inx,charLine,rem,div
0,1872 – 1892,0,0
1,Impressionism,1,0
2,Summary: Masters of color and light. Marked a radical departure from the realistic academic painting that had dominated the eras prior.,2,0
3,"Key artists: Claude Monet, Pierre-Auguste Renoir, Camille Pissarro, Edgar Degas, Edouard Manet, Mary Cassatt",3,0val dataModernArt=data.filter('rem===0).
join(data.filter('rem===1),"div").
join(data.filter('rem===2),"div").
join(data.filter('rem===3),"div").
join(data.filter('rem===4),"div").
drop("rem","inx").
toDF("rownumber","time","artMovement","summary","keyArtists","aboutArt")
display(dataModernArt)val dataModernArtArtist=dataModernArt.drop("summary","aboutArt").
withColumn("keyArtistList",
regexp_replace(regexp_replace(col("keyArtists"),"\\(.+?\\)",""),
"Key artists: ","")).
withColumn("keyArtistText",explode(split(col("keyArtistList"),","))).
withColumn("keyArtist",trim(col("keyArtistText")))
display(dataModernArtArtist.select("rownumber","time","artMovement","keyArtist"))
0,1872 – 1892,Impressionism,Claude Monet
0,1872 – 1892,Impressionism,Pierre-Auguste Renoir
0,1872 – 1892,Impressionism,Camille Pissarro
0,1872 – 1892,Impressionism,Edgar Degas
0,1872 – 1892,Impressionism,Edouard Manet
0,1872 – 1892,Impressionism,Mary Cassatt
1,Early 1880s - 1914,Post-Impressionism,Paul Cézanne
1,Early 1880s - 1914,Post-Impressionism,Vincent Van Gogh
1,Early 1880s - 1914,Post-Impressionism,Paul Gauguin
1,Early 1880s - 1914,Post-Impressionism,Georges-Pierre Seurat
1,Early 1880s - 1914,Post-Impressionism,Paul Signac
2,1905 - 1910,Fauvism,Henri Matisse
2,1905 - 1910,Fauvism,André Derain
2,1905 - 1910,Fauvism,Maurice de Vlaminck
2,1905 - 1910,Fauvism,Kees van Dongen
3,1905 – 1933,Expressionism,Ernst Ludwig Kirchner
3,1905 – 1933,Expressionism,Käthe Kollwitz
3,1905 – 1933,Expressionism,Wassily Kandinsky
3,1905 – 1933,Expressionism,Edvard Munch
4,1907 – 1922,Cubism,Pablo Picasso
4,1907 – 1922,Cubism,Georges Braque
4,1907 – 1922,Cubism,Juan Gris
4,1907 – 1922,Cubism,Fernand Léger
5,1909 – late 1920s,Futurism,Umberto Boccioni
5,1909 – late 1920s,Futurism,Carlo Carrà
5,1909 – late 1920s,Futurism,Giacomo Balla
5,1909 – late 1920s,Futurism,Natalia Goncharova
6,1913 – late 1920s,Suprematism,Kazimir Malevich
6,1913 – late 1920s,Suprematism,El Lissitzky
6,1913 – late 1920s,Suprematism,Olga Rozanova
6,1913 – late 1920s,Suprematism,Lyubov Popova
7,1917 – 1931,De Stijl,Theo van Doesburg
7,1917 – 1931,De Stijl,Piet Mondrian
7,1917 – 1931,De Stijl,Vilmos Huszar
7,1917 – 1931,De Stijl,Gerrit Rietveld
8,1915-late 1930s,Constructivism,Vladimir Tatlin
8,1915-late 1930s,Constructivism,Alexander Rodchenko
8,1915-late 1930s,Constructivism,Varvara Stepanova
8,1915-late 1930s,Constructivism,Aleksandra Ekster
8,1915-late 1930s,Constructivism,Lyubov Popova
9,1916-1924,Dada,Francis Picabia
9,1916-1924,Dada,Hugo Ball
9,1916-1924,Dada,Hans Arp
9,1916-1924,Dada,Tristan Tzara
10,1924-1966,Surrealism,Joan Miró
10,1924-1966,Surrealism,Salvador Dalí
10,1924-1966,Surrealism,René Magritte
10,1924-1966,Surrealism,André Breton
10,1924-1966,Surrealism,Yves Tanguy
10,1924-1966,Surrealism,Frida Kahlo
10,1924-1966,Surrealism,Max Ernst
10,1924-1966,Surrealism,Méret Oppenheim
11,1943 – 1965,Abstract Expressionism,Willem de Kooning
11,1943 – 1965,Abstract Expressionism,Clyfford Still
11,1943 – 1965,Abstract Expressionism,Mark Rothko
11,1943 – 1965,Abstract Expressionism,Jackson Pollock
12,Mid-1950s - early 1970s,Pop Art,Andy Warhol
12,Mid-1950s - early 1970s,Pop Art,Roy Lichtenstein
12,Mid-1950s - early 1970s,Pop Art,Claes Oldenburg
12,Mid-1950s - early 1970s,Pop Art,James Rosenquist
12,Mid-1950s - early 1970s,Pop Art,Richard Hamilton
13,Early 1960s - late 1960s,Minimalism,Frank Stella
13,Early 1960s - late 1960s,Minimalism,Tony Smith
13,Early 1960s - late 1960s,Minimalism,Carl Andre
13,Early 1960s - late 1960s,Minimalism,Richard Serra
13,Early 1960s - late 1960s,Minimalism,Dan Flavin
14,Mid-1960s onwards,Conceptual Art,Joseph Kosuth
14,Mid-1960s onwards,Conceptual Art,Walter de Maria
14,Mid-1960s onwards,Conceptual Art,John Baldessari
14,Mid-1960s onwards,Conceptual Art,Sol LeWitt
14,Mid-1960s onwards,Conceptual Art,Joseph Beuys
15,1974-1984,Pictures Generation,Cindy Sherman
15,1974-1984,Pictures Generation,Barbara Kruger
15,1974-1984,Pictures Generation,Robert Longo
15,1974-1984,Pictures Generation,Richard Prince
16,Late 1970s - early 1990s,Neo-Expressionism,Georg Baselitz
16,Late 1970s - early 1990s,Neo-Expressionism,Julian Schnabel
16,Late 1970s - early 1990s,Neo-Expressionism,Francesco Clemente
16,Late 1970s - early 1990s,Neo-Expressionism,Jean-Michel Basquiatval modernArtData = dataModernArtArtist.
select("time","artMovement","keyArtist").
join(bioArtistList,'keyArtist==='src).drop("src").distinct
display(modernArtArtist)
time,artMovement,keyArtist
1905 - 1910,Fauvism,Henri Matisse
1943 – 1965,Abstract Expressionism,Jackson Pollock
1924-1966,Surrealism,Joan Miró
Early 1880s - 1914,Post-Impressionism,Paul Gauguin
1907 – 1922,Cubism,Georges Braque
Early 1880s - 1914,Post-Impressionism,Paul Cézanne
1907 – 1922,Cubism,Pablo Picasso
Early 1880s - 1914,Post-Impressionism,Paul Signac
1917 – 1931,De Stijl,Piet Mondrian
1872 – 1892,Impressionism,Claude Monet
1909 – late 1920s,Futurism,Natalia Goncharova
1913 – late 1920s,Suprematism,Kazimir Malevich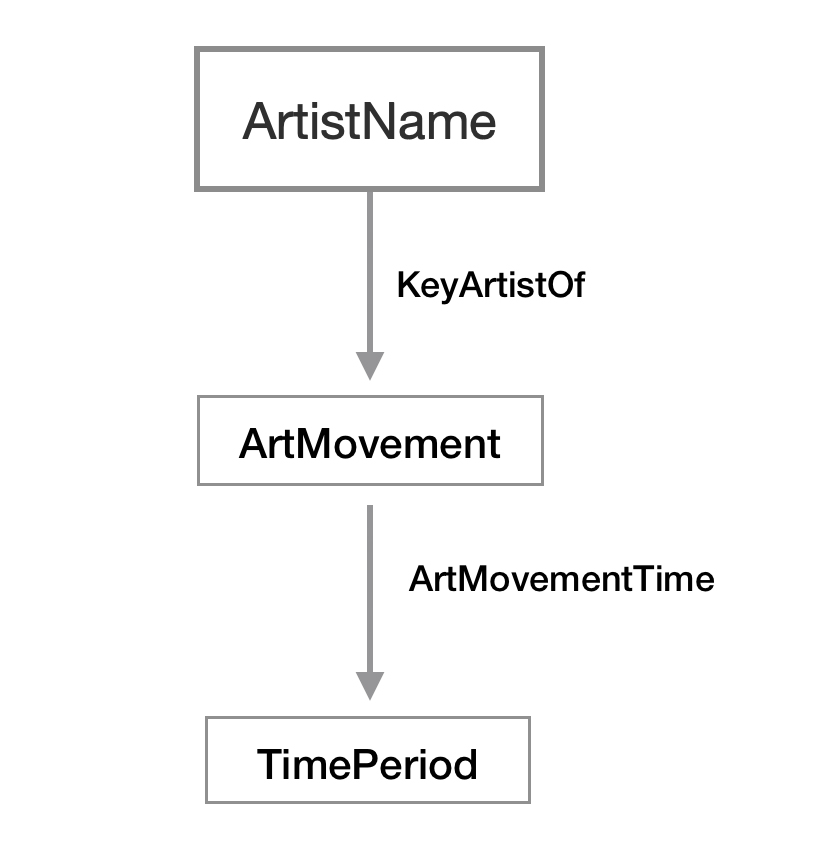 Modern Art Movement knowledge graph edges:
val modernArtEdges=
  modernArtData.select("keyArtist","artMovement").toDF("src","dst").
  withColumn("edgeId",lit("artMovement")).union(
  modernArtData.select("artMovement","time").toDF("src","dst").
withColumn("edgeId",lit("time"))).distinctval modernArtGraph=GraphFrame(
modernArtEdges.select("src").
union(modernArtEdges.select("dst")).distinct.toDF("id"),
modernArtEdges.distinct)display(graph2dot(modernArtGraph))
"Jackson Pollock" -> "Abstract Expressionism" [label="artMovement"];
"Fauvism" -> "1905 - 1910" [label="time"];
"Paul Cézanne" -> "Post-Impressionism" [label="artMovement"];
"Cubism" -> "1907 – 1922" [label="time"];
"Kazimir Malevich" -> "Suprematism" [label="artMovement"];
"Impressionism" -> "1872 – 1892" [label="time"];
"Abstract Expressionism" -> "1943 – 1965" [label="time"];
"Futurism" -> "1909 – late 1920s" [label="time"];
"Paul Signac" -> "Post-Impressionism" [label="artMovement"];
"Piet Mondrian" -> "De Stijl" [label="artMovement"];
"Henri Matisse" -> "Fauvism" [label="artMovement"];
"Pablo Picasso" -> "Cubism" [label="artMovement"];
"Suprematism" -> "1913 – late 1920s" [label="time"];
"Natalia Goncharova" -> "Futurism" [label="artMovement"];
"Georges Braque" -> "Cubism" [label="artMovement"];
"Joan Miró" -> "Surrealism" [label="artMovement"];
"Post-Impressionism" -> "Early 1880s - 1914" [label="time"];
"De Stijl" -> "1917 – 1931" [label="time"];
"Claude Monet" -> "Impressionism" [label="artMovement"];
"Surrealism" -> "1924-1966" [label="time"];
"Paul Gauguin" -> "Post-Impressionism" [label="artMovement"];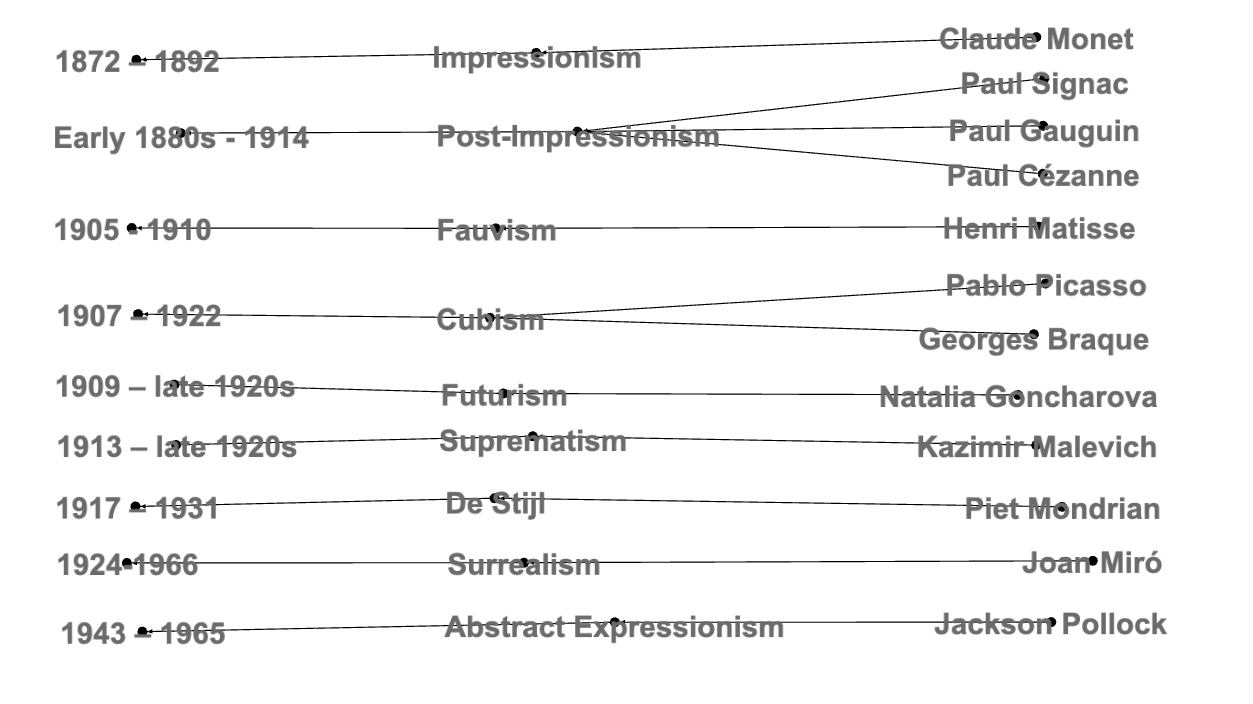
Artist Pairs within Modern Art Movement Key Artists list
Ontology of integrated graph:
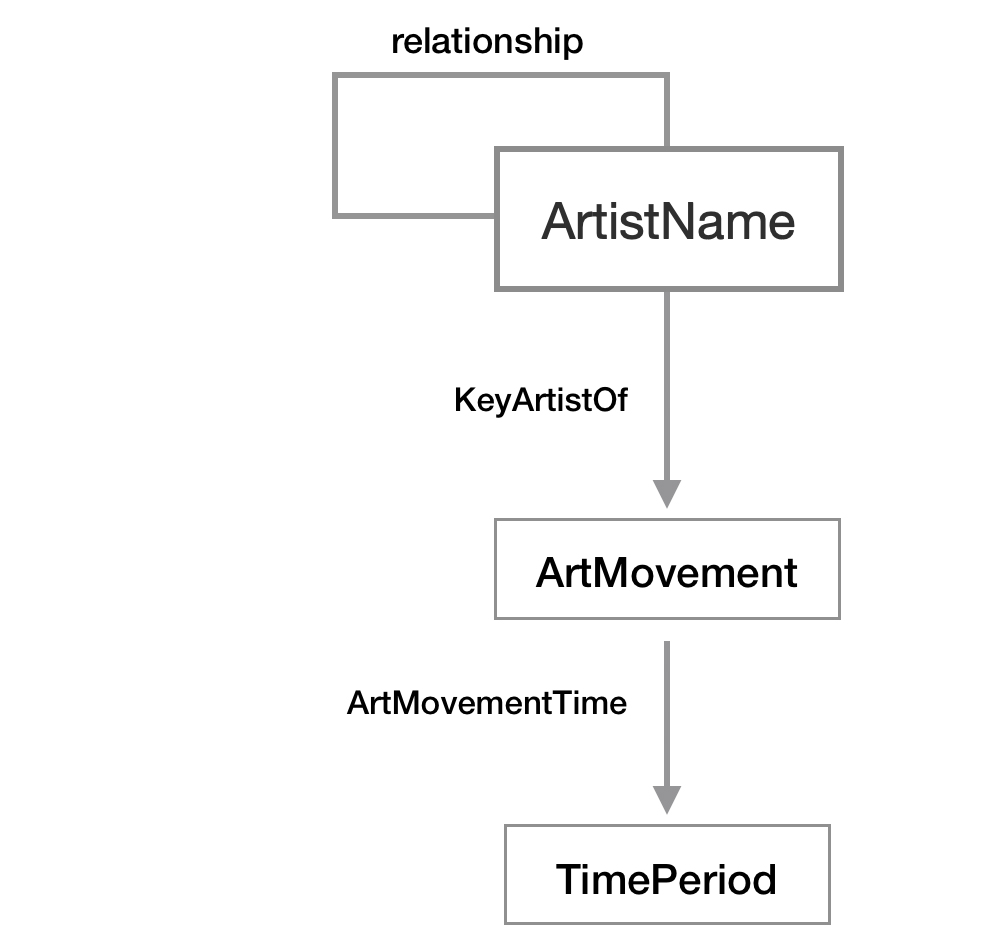
Data integration
To add artist pair relationship info to modern art movement info we will combine edges of Modern Art Movement and Artist Pairs knowledge graphs:
val modernArtPairGraph=GraphFrame(
  artistPairGraph.edges.union(modernArtGraph.edges).select("src").
  union(artistPairGraph.edges.union(modernArtGraph.edges).select("dst")).distinct.toDF("id"),
  artistPairGraph.edges.union(modernArtGraph.edges)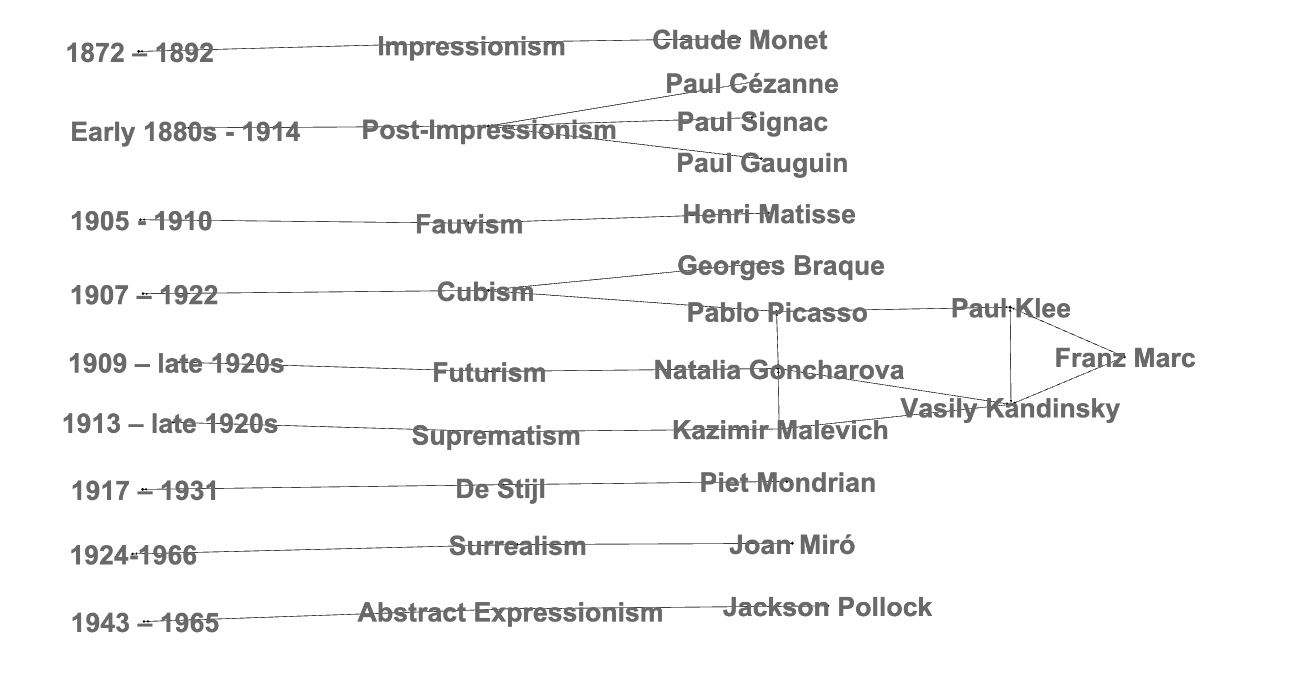
)display(graph2dot(modernArtPairGraph))
"Vasily Kandinsky" -> "Franz Marc" [label="relationship"];
"Vasily Kandinsky" -> "Kazimir Malevich" [label="relationship"];
"Paul Klee" -> "Vasily Kandinsky" [label="relationship"];
"Paul Klee" -> "Franz Marc" [label="relationship"];
"Paul Klee" -> "Pablo Picasso" [label="relationship"];
"Abstract Expressionism" -> "1943 – 1965" [label="time"];
"Futurism" -> "1909 – late 1920s" [label="time"];
"Natalia Goncharova" -> "Pablo Picasso" [label="relationship"];
"Paul Signac" -> "Post-Impressionism" [label="artMovement"];
"Piet Mondrian" -> "De Stijl" [label="artMovement"];
"Franz Marc" -> "Paul Klee" [label="relationship"];
"Natalia Goncharova" -> "Kazimir Malevich" [label="relationship"];
"Pablo Picasso" -> "Paul Klee" [label="relationship"];
"Henri Matisse" -> "Fauvism" [label="artMovement"];
"Kazimir Malevich" -> "Natalia Goncharova" [label="relationship"];
"Vasily Kandinsky" -> "Paul Klee" [label="relationship"];
"Pablo Picasso" -> "Cubism" [label="artMovement"];
"Suprematism" -> "1913 – late 1920s" [label="time"];
"Natalia Goncharova" -> "Futurism" [label="artMovement"];
"Kazimir Malevich" -> "Vasily Kandinsky" [label="relationship"];
"Georges Braque" -> "Cubism" [label="artMovement"];
"Joan Miró" -> "Surrealism" [label="artMovement"];
"Post-Impressionism" -> "Early 1880s - 1914" [label="time"];
"De Stijl" -> "1917 – 1931" [label="time"];
"Claude Monet" -> "Impressionism" [label="artMovement"];
"Surrealism" -> "1924-1966" [label="time"];
"Pablo Picasso" -> "Natalia Goncharova" [label="relationship"];
"Paul Gauguin" -> "Post-Impressionism" [label="artMovement"];
Add Artist Biography info to Modern Art Movement key artists
Ontology of integrated graph: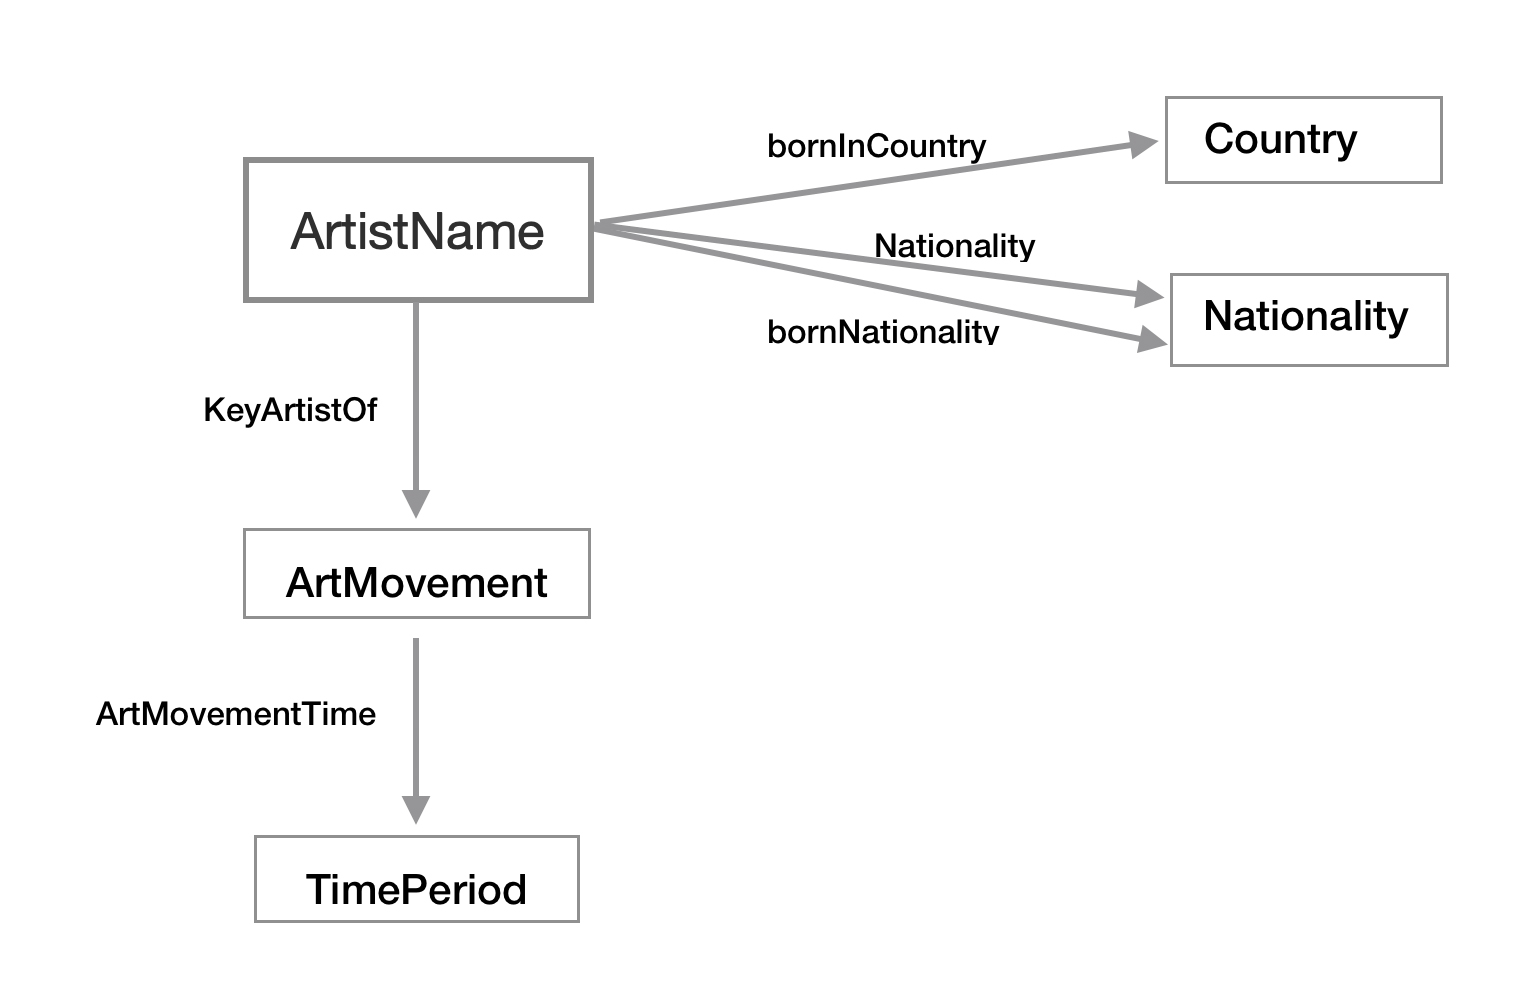
Data integration
From Artist Biography knowledge graph we will take information about nationalities and born countries of modern art key artists.
val modernArtKeyArtists = modernArtData.select("keyArtist")
display(modernArtKeyArtists.orderBy("keyArtist"))
Claude Monet
Georges Braque
Henri Matisse
Jackson Pollock
Joan Miró
Kazimir Malevich
Natalia Goncharova
Pablo Picasso
Paul Cézanne
Paul Gauguin
Paul Signac
Piet Mondrian
Combine edges of Artist Biography knowledge graph and edges of Modern Art Movement knowledge graph and exclude edges related to genders and dates:
val modernArtBioEdges=artistBioGraph.edges.
  join(modernArtKeyArtists,'src==='keyArtist).drop("keyArtist").
  union(modernArtGraph.edges).
  filter(not('edgeId.isin("EndDate","BeginDate","Gender")))
Biographies of Modern Art Movement key artists:
val modernArtBioGraph=GraphFrame(
  modernArtBioEdges.select("src").
  union(modernArtBioEdges.select("dst")).distinct.toDF("id"),
  modernArtBioEdges)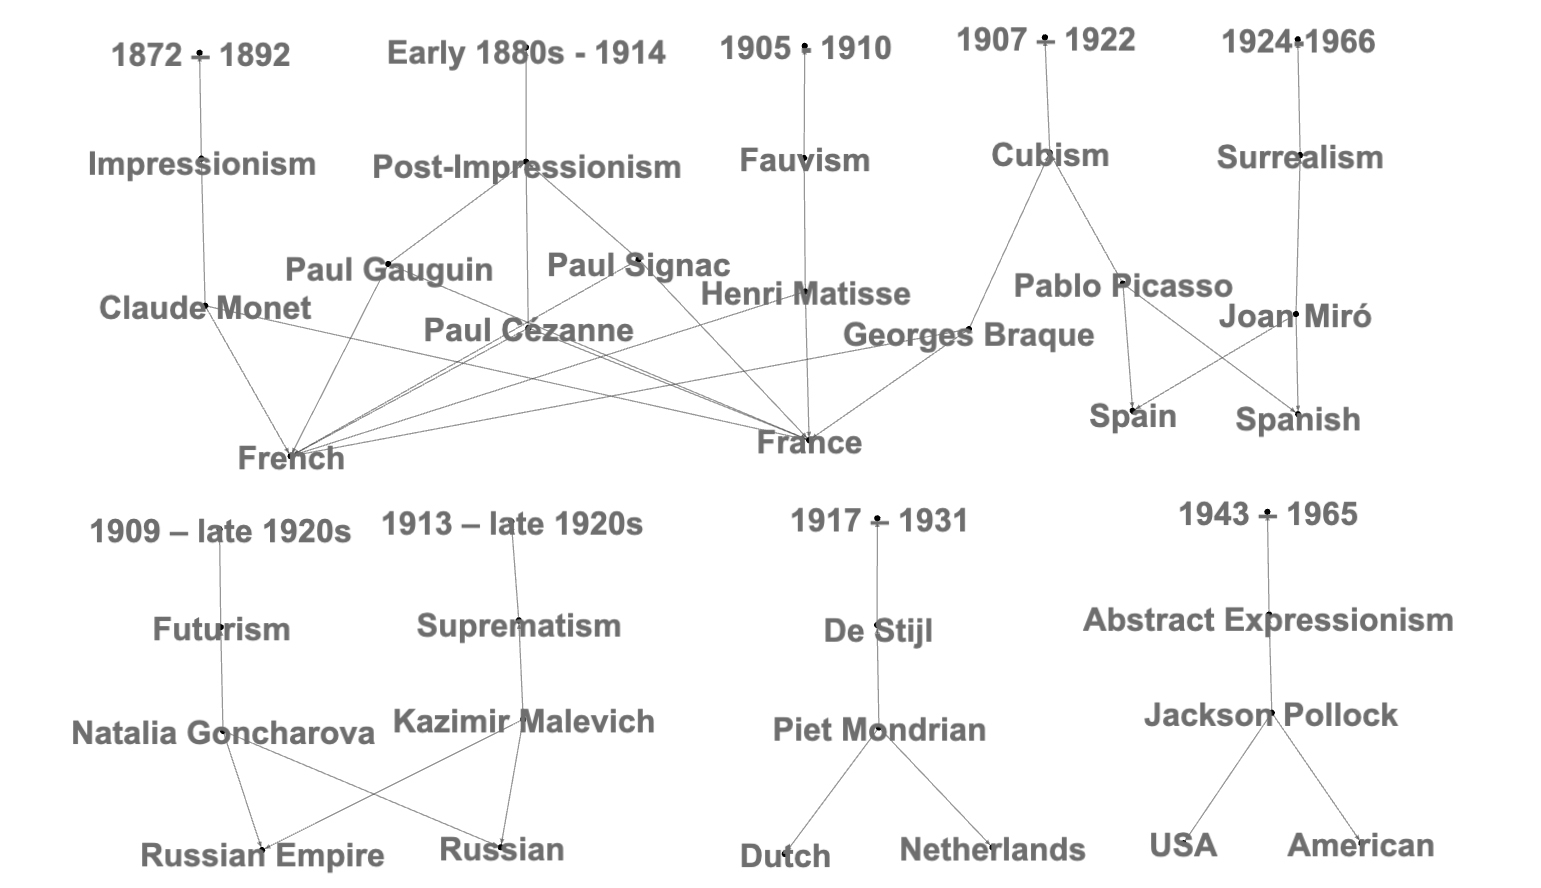
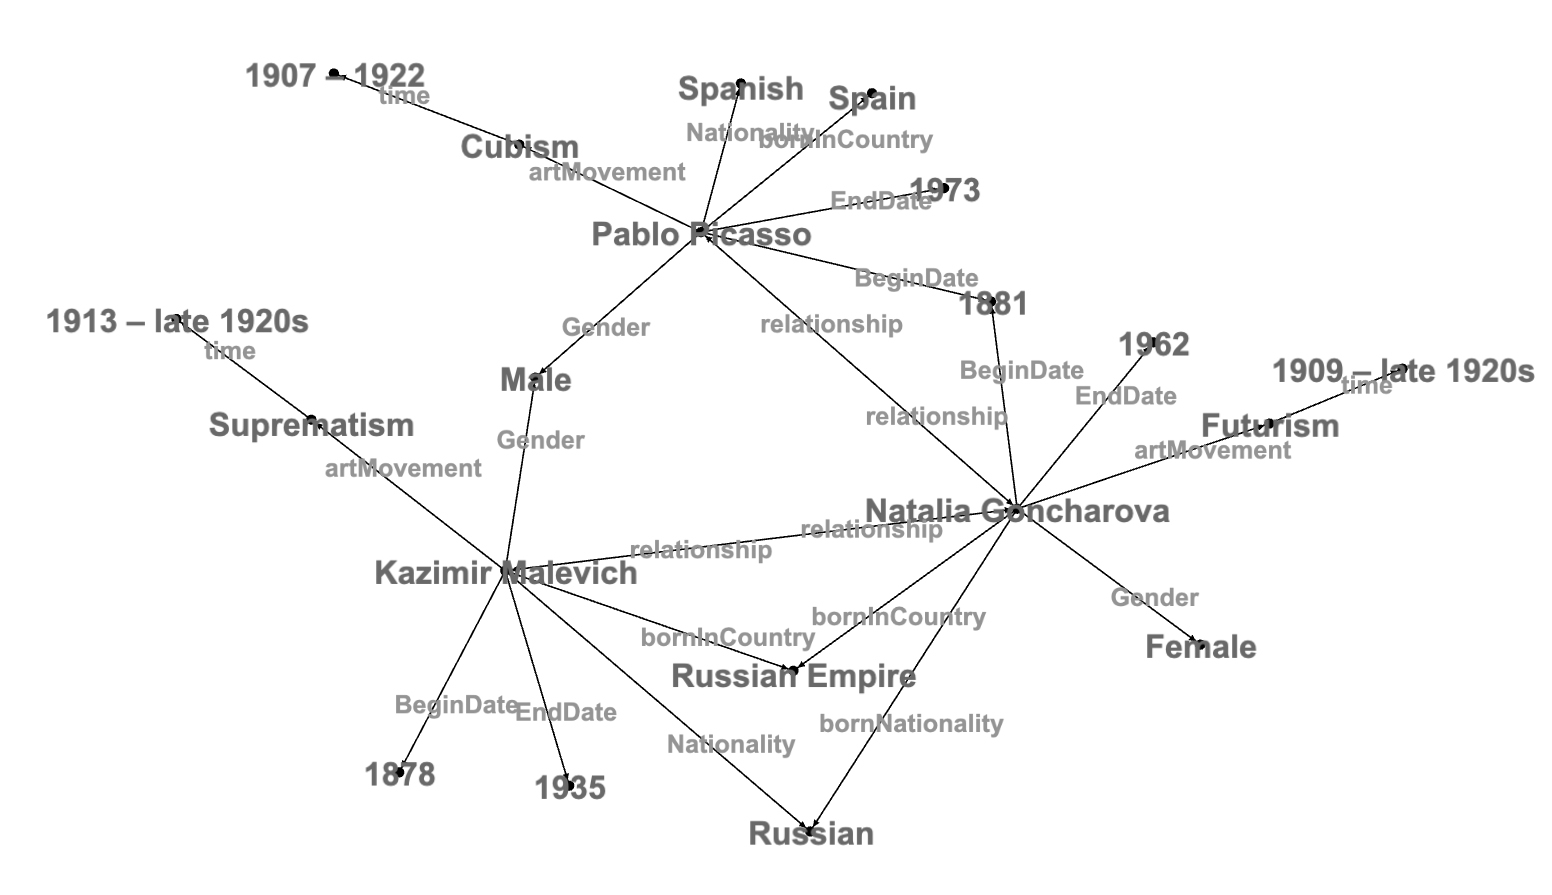
Integrate All Three Knowledge Graphs
Metadata integration
Ontology of integrated graph:
Data Integration
First from each graph we will get artist name list then calculate overlap of these artist lists.
Artist names from Artist Biography knowledge graph:
val artistBioNodes=artistBioGraph.vertices.distinct.toDF("id1")Artist names from Artist Pairs knowledge graph:
val artistPairNodes=artistPairGraph.vertices.distinct.toDF("id2")Artist names from Modern Art Movement knowledge graph:
val modernArtNodes=modernArtGraph.vertices.distinct.toDF("id3")There are only three artist names that are in each of three knowledge graphs:
val artistNodes=artistBioNodes.join(artistPairNodes,'id1==='id2).
  join(modernArtNodes,'id2==='id3).drop("id2","id3").toDF("id")
display(artistNodes)
Pablo Picasso
Kazimir Malevich
Natalia Goncharova
Next, we need to get edges from knowledge graphs related to overlapping artists.
As Artist Biography knowledge graph is artist name centric, to get combined graph edges we will filter them by edge 'src':
val artistBioEdges=artistBioGraph.edges.
  join(artistNodes,'src==='id).drop("id")
To get edges from Artist Pairs knowledge graph we need to filter them by both edge parameters - 'src' and edge 'dst':
val artistPairEdges=artistPairGraph.edges.join(artistNodes,'src==='id1).
  join(artistNodes.toDF("id2"),'dst==='id2).drop("id1","id2").distinct
Modern Art Movement knowledge graph has two types of edges: Artist -> Modern Art Movement and Modern Art Movement -> time period. {Artist, Modern Art Movement} edges :
val modernArtEdges1=modernArtGraph.edges.
  join(artistNodes,'src==='id1).drop("id1")
{Modern Art Movement, time period} edges:
val modernArtEdges2=modernArtGraph.edges.join(modernArtEdges1.
  select("dst").toDF("dst1"),'src==='dst1).drop("dst1")
Edges of combined graph:
val artistEdges=artistBioEdges.
  union(artistPairEdges).
  union(modernArtEdges1).
union(modernArtEdges2)val artistGraph=GraphFrame(artistNodes,artistEdges)
display(graph2dot(artistGraph).orderBy("dotLine"))
"Cubism" -> "1907 – 1922" [label="time"];
"Futurism" -> "1909 – late 1920s" [label="time"];
"Kazimir Malevich" -> "1878" [label="BeginDate"];
"Kazimir Malevich" -> "1935" [label="EndDate"];
"Kazimir Malevich" -> "Male" [label="Gender"];
"Kazimir Malevich" -> "Natalia Goncharova" [label="relationship"];
"Kazimir Malevich" -> "Russian Empire" [label="bornInCountry"];
"Kazimir Malevich" -> "Russian" [label="Nationality"];
"Kazimir Malevich" -> "Russian" [label="bornNationality"];
"Kazimir Malevich" -> "Suprematism" [label="artMovement"];
"Natalia Goncharova" -> "1881" [label="BeginDate"];
"Natalia Goncharova" -> "1962" [label="EndDate"];
"Natalia Goncharova" -> "Female" [label="Gender"];
"Natalia Goncharova" -> "Futurism" [label="artMovement"];
"Natalia Goncharova" -> "Kazimir Malevich" [label="relationship"];
"Natalia Goncharova" -> "Pablo Picasso" [label="relationship"];
"Natalia Goncharova" -> "Russian Empire" [label="bornInCountry"];
"Natalia Goncharova" -> "Russian" [label="Nationality"];
"Natalia Goncharova" -> "Russian" [label="bornNationality"];
"Pablo Picasso" -> "1881" [label="BeginDate"];
"Pablo Picasso" -> "1973" [label="EndDate"];
"Pablo Picasso" -> "Cubism" [label="artMovement"];
"Pablo Picasso" -> "Male" [label="Gender"];
"Pablo Picasso" -> "Natalia Goncharova" [label="relationship"];
"Pablo Picasso" -> "Spain" [label="bornInCountry"];
"Pablo Picasso" -> "Spanish" [label="Nationality"];
"Pablo Picasso" -> "Spanish" [label="bornNationality"];
"Suprematism" -> "1913 – late 1920s" [label="time"];