Semantic Knowledge Graphs
In this post we will show some specific examples of using knowledge graph for data mining. Using the same Kaggle dataset as in previous post 'Museum of Modern Art Collection' from MoMA collection we will deeper explore titles of paintings and time when paintings were created. Analyzing title semantics we will show connections between artists and titles as well as differences in modern art styles in different time periods.
Read and Clean the Data
import org.apache.spark.ml._
import org.apache.spark.ml.feature._
import org.apache.spark.sql.DataFrame
import org.graphframes.GraphFrame
import org.apache.spark.sql.functions._

val data=sqlContext.read.format("csv").
  option("header","true").load("/FileStore/tables/daYes2.txt")
Get artist names, painting titles and dates when paintings were created:
val titleData=data.select("Artist","Title","Date").distinct

display(titleData)
Artist,Title,Date
Joan Miró,"Rope and People, I","Barcelona, March 27, 1935"
Paul Klee,Fire in the Evening,1929
Paul Klee,Portrait of an Equilibrist,1927
Pablo Picasso,Guitar,"Paris, early 1919"
Paul Cézanne,The Bather,c. 1885
Piet Mondrian,"Composition in White, Black, and Red",Paris 1936
Pablo Picasso,Girl before a Mirror,"Paris, March 14, 1932"
Georges Braque,Woman with a Mandolin,1937
Vasily Kandinsky,Panel for Edwin R. Campbell No. 3,1914
Paul Gauguin,Portrait of Jacob Meyer de Haan,1889
Vasily Kandinsky,Panel for Edwin R. Campbell No. 1,1914
Max Beckmann,Departure,"Frankfurt 1932, Berlin 1933-35"
Jackson Pollock,Shimmering Substance,1946
Henri Matisse,Still Life,"Paris, early 1899"
Jackson Pollock,"One: Number 31, 1950",1950
Georges Braque,Soda,"Paris, spring 1912"
When Paintings Were Created?
Looking at data examples we can see that "Date" column has a semi-structured data. Some of these column values have just a year, some columns show time periods, some columns show specific months or days, and some columns show time and place where the painting was created.
'Date' column examples:
Paul Klee, Fire in the Evening,
1929
Joan Miró, Rope and People, I,
Barcelona, March 27, 1935
Pablo Picasso, Guitar,
Paris, early 1919
Paul Cézanne, Still Life with Apples,
1895-98
Max Beckmann, Family Picture,
Frankfurt 1920
Joan Miró, The Hunter (Catalan Landscape),
July 1923-winter 1924
Henri Matisse, Gourds,
1915-16 (dated on painting 1916)
Georges Braque, Man with a Guitar,
Céret, summer 1911-early 1912
Kazimir Malevich, Suprematist Painting,
1916-17
Natalia Goncharova, Rayonism, Blue-Green Forest,
1913 (dated on reverse 1911)
Max Beckmann, Departure,
Frankfurt 1932, Berlin 1933-35
Piet Mondrian, Truncated View of the Broekzijder Mill on the Gein, Wings Facing West,
c. 1902-03 or earlier
Henri Matisse, The Red Studio,
Issy-les-Moulineaux, fall 1911
Claude Monet, Water Lilies,
1914-26
Marc Chagall, Over Vitebsk,
1915-20 (after a painting of 1914)
Jackson Pollock, Circle,
c. 1938-41
Henri Matisse, The Red Studio,
Issy-les-Moulineaux, fall 1911
Henri Matisse, Goldfish and Palette,
Paris, quai Saint-Michel, late November 1914-spring 1915
Joan Miró, Still Life with Old Shoe,
Paris, January 24-May 29, 1937
Cleaning the data
To define the year when painting was created we will extract the latest year from 'Date' columns:val titleLastYear=titleData.
withColumn("period",regexp_extract(col("Date"),"\\d{4}-\\d{2}",0)).
withColumn("periodEnd",concat(substring(col("period"),1,2),substring(col("period"),6,7))).
withColumn("year1",regexp_extract(col("Date"),"\\d{4}",0)).
withColumn("date2",regexp_replace(col("Date"), col("period"), lit(""))).
withColumn("date3",regexp_replace(col("date2"), col("year1"), lit(""))).
withColumn("year2",regexp_extract(col("date3"),"\\d{4}",0)).
withColumn("year3",greatest("year1","periodEnd")).
withColumn("lastYear",greatest("year2","year3")).
drop("period","periodEnd","year1","date2","date3","year2","year3")
display(titleLastYear)
Artist,Title,Date,lastYear
Joan Miró,"Rope and People, I","Barcelona, March 27, 1935",1935
Paul Klee,Fire in the Evening,1929,1929
Pablo Picasso,Girl before a Mirror,"Paris, March 14, 1932",1932
Max Beckmann,Departure,"Frankfurt 1932, Berlin 1933-35",1935
Joan Miró,Still Life I,Montroig and Paris 1922-23,1923
Paul Cézanne,"Still Life with Ginger Jar, Sugar Bowl, and Oranges",1902-06,1906
Henri Matisse,Gourds,"Issy-les-Moulineaux, 1915-16 (dated on painting 1916)",1916
Vincent van Gogh,Portrait of Joseph Roulin,"Arles, early 1889",1889
Piet Mondrian,"Truncated View of the Broekzijder Mill on the Gein, Wings Facing West",c. 1902-03 or earlier,1903
Henri Matisse,Chasuble,1950-52 (manufactured 1955),1955
Joan Miró,Mural Painting,"Barcelona, October 18, 1950-January 26, 1951",1951
Claude Monet,Water Lilies,1914-26,1926
Natalia Goncharova,"Rayonism, Blue-Green Forest",1913 (dated on reverse 1911),1913
Transform Painting Titles to Words
To analyze 'Title' text column we will use the following data preparation process:- Read text column
- Tokenize text column
- Remove stop words
display(titleLastYear.groupBy("Artist").count.orderBy('count.desc))
Pablo Picasso,55
Henri Matisse,34
Joan Miró,19
Jackson Pollock,18
Piet Mondrian,16
Paul Klee,14
Georges Braque,10
Paul Cézanne,9
Vasily Kandinsky,7
Kazimir Malevich,7
Claude Monet,5
Oskar Kokoschka,4
Max Beckmann,4
Marc Chagall,4
Vincent van Gogh,3
Paul Gauguin,3
Natalia Goncharova,2
Paul Signac,2
Egon Schiele,1
Franz Marc,1val tokenizer = new RegexTokenizer().
setInputCol("Title").
setOutputCol("value").
setPattern("[^a-z]+").
setMinTokenLength(3).
setGaps(true)
val tokenizedTitle = tokenizer.
transform(titleLastYear)
display(tokenizedTitle.select("Artist","Title","value"))
Joan Miró,"Rope and People, I","[""rope"",""and"",""people""]"
Paul Klee,Fire in the Evening,"[""fire"",""the"",""evening""]"
Pablo Picasso,Guitar,"[""guitar""]"
Paul Cézanne,The Bather,"[""the"",""bather""]"
Georges Braque,Woman with a Mandolin,"[""woman"",""with"",""mandolin""]"
val remover = new StopWordsRemover().
   setInputCol("value").
   setOutputCol("stopWordFree")
val removedStopWordsTittle = remover.
   setStopWords(Array("none","also","nope","null")++
   remover.getStopWords).
   transform(tokenizedTittle)

display(removedStopWordsTitle.select("Artist","Title","value","stopWordFree"))
Joan Miró,"Rope and People, I","[""rope"",""and"",""people""]","[""rope"",""people""]"
Paul Klee,Fire in the Evening,"[""fire"",""the"",""evening""]","[""fire"",""evening""]"
Pablo Picasso,Guitar,"[""guitar""]","[""guitar""]"
Paul Cézanne,The Bather,"[""the"",""bather""]","[""bather""]"
Georges Braque,Woman with a Mandolin,"[""woman"",""with"",""mandolin""]","[""woman"",""mandolin""]"val slpitTitleData = removedStopWordsTitle.
withColumn("titleWord",explode($"stopWordFree")).
drop("value","stopWordFree").distinct
display(slpitTitleData.select("Artist","Title","titleWord").orderBy("Artist","Title"))
Claude Monet,Agapanthus,agapanthus
Claude Monet,"On the Cliff at Pourville, Clear Weather",weather
Claude Monet,"On the Cliff at Pourville, Clear Weather",cliff
Claude Monet,"On the Cliff at Pourville, Clear Weather",clear
Claude Monet,"On the Cliff at Pourville, Clear Weather",pourville
Claude Monet,The Japanese Footbridge,footbridge
Claude Monet,The Japanese Footbridge,japanese
Claude Monet,Water Lilies,lilies
Claude Monet,Water Lilies,waterTitle Words Analysis
{Artist, Title Words} distribution
How many title words artists used in their titles?display(slpitTitleData.groupBy("Artist").count.orderBy('count.desc))
Pablo Picasso,125
Henri Matisse,83
Piet Mondrian,60
Joan Miró,55
Paul Klee,29
Jackson Pollock,28
Paul Cézanne,27
Georges Braque,26
Kazimir Malevich,25
Paul Signac,20
Vasily Kandinsky,19
Oskar Kokoschka,12
Paul Gauguin,10
Claude Monet,9
Max Beckmann,8
Vincent van Gogh,7
Natalia Goncharova,5
Marc Chagall,4
Egon Schiele,3
Franz Marc,2display(slpitTitleData.select("Artist","titleWord").distinct.groupBy("Artist").count.orderBy('count.desc))
Pablo Picasso,85
Henri Matisse,74
Joan Miró,45
Piet Mondrian,32
Paul Klee,28
Jackson Pollock,25
Georges Braque,25
Paul Cézanne,23
Kazimir Malevich,22
Paul Signac,19
Oskar Kokoschka,12
Paul Gauguin,10
Claude Monet,9
Vasily Kandinsky,9
Max Beckmann,8
Vincent van Gogh,7
Natalia Goncharova,5
Marc Chagall,4
Egon Schiele,3
Franz Marc,2Different artists used different words. For example, Paul Signac and Kazimir Malevich had very different styles so they used very different words to describe their paintings:
display(slpitTitleData.select("Artist","titleWord","Title").
  filter('Artist==="Paul Signac").orderBy("titleWord","Title"))
Paul Signac,adagio,"Setting Sun. Sardine Fishing. Adagio. Opus 221 from the series The Sea, The Boats, Concarneau"
Paul Signac,angles,"Opus 217. Against the Enamel of a Background Rhythmic with Beats and Angles, Tones, and Tints, Portrait of M. Félix Fénéon in 1890"
Paul Signac,background,"Opus 217. Against the Enamel of a Background Rhythmic with Beats and Angles, Tones, and Tints, Portrait of M. Félix Fénéon in 1890"
Paul Signac,beats,"Opus 217. Against the Enamel of a Background Rhythmic with Beats and Angles, Tones, and Tints, Portrait of M. Félix Fénéon in 1890"
Paul Signac,boats,"Setting Sun. Sardine Fishing. Adagio. Opus 221 from the series The Sea, The Boats, Concarneau"
Paul Signac,concarneau,"Setting Sun. Sardine Fishing. Adagio. Opus 221 from the series The Sea, The Boats, Concarneau"
Paul Signac,enamel,"Opus 217. Against the Enamel of a Background Rhythmic with Beats and Angles, Tones, and Tints, Portrait of M. Félix Fénéon in 1890"
Paul Signac,fishing,"Setting Sun. Sardine Fishing. Adagio. Opus 221 from the series The Sea, The Boats, Concarneau"
Paul Signac,lix,"Opus 217. Against the Enamel of a Background Rhythmic with Beats and Angles, Tones, and Tints, Portrait of M. Félix Fénéon in 1890"
Paul Signac,opus,"Opus 217. Against the Enamel of a Background Rhythmic with Beats and Angles, Tones, and Tints, Portrait of M. Félix Fénéon in 1890"
Paul Signac,opus,"Setting Sun. Sardine Fishing. Adagio. Opus 221 from the series The Sea, The Boats, Concarneau"
Paul Signac,portrait,"Opus 217. Against the Enamel of a Background Rhythmic with Beats and Angles, Tones, and Tints, Portrait of M. Félix Fénéon in 1890"
Paul Signac,rhythmic,"Opus 217. Against the Enamel of a Background Rhythmic with Beats and Angles, Tones, and Tints, Portrait of M. Félix Fénéon in 1890"
Paul Signac,sardine,"Setting Sun. Sardine Fishing. Adagio. Opus 221 from the series The Sea, The Boats, Concarneau"
Paul Signac,sea,"Setting Sun. Sardine Fishing. Adagio. Opus 221 from the series The Sea, The Boats, Concarneau"
Paul Signac,series,"Setting Sun. Sardine Fishing. Adagio. Opus 221 from the series The Sea, The Boats, Concarneau"
Paul Signac,setting,"Setting Sun. Sardine Fishing. Adagio. Opus 221 from the series The Sea, The Boats, Concarneau"
Paul Signac,sun,"Setting Sun. Sardine Fishing. Adagio. Opus 221 from the series The Sea, The Boats, Concarneau"
Paul Signac,tints,"Opus 217. Against the Enamel of a Background Rhythmic with Beats and Angles, Tones, and Tints, Portrait of M. Félix Fénéon in 1890"
Paul Signac,tones,"Opus 217. Against the Enamel of a Background Rhythmic with Beats and Angles, Tones, and Tints, Portrait of M. Félix Fénéon in 1890"display(slpitTitleData.select("Artist","titleWord","Title").
filter('Artist==="Kazimir Malevich").orderBy("titleWord","Title"))
Kazimir Malevich,airplane,Suprematist Composition: Airplane Flying
Kazimir Malevich,arrangement,Woman with Pails: Dynamic Arrangement
Kazimir Malevich,boy,Painterly Realism of a Boy with a Knapsack - Color Masses in the Fourth Dimension
Kazimir Malevich,color,Painterly Realism of a Boy with a Knapsack - Color Masses in the Fourth Dimension
Kazimir Malevich,composition,Suprematist Composition: Airplane Flying
Kazimir Malevich,composition,Suprematist Composition: White on White
Kazimir Malevich,dimension,Painterly Realism of a Boy with a Knapsack - Color Masses in the Fourth Dimension
Kazimir Malevich,division,Reservist of the First Division
Kazimir Malevich,dynamic,Woman with Pails: Dynamic Arrangement
Kazimir Malevich,first,Reservist of the First Division
Kazimir Malevich,flying,Suprematist Composition: Airplane Flying
Kazimir Malevich,fourth,Painterly Realism of a Boy with a Knapsack - Color Masses in the Fourth Dimension
Kazimir Malevich,knapsack,Painterly Realism of a Boy with a Knapsack - Color Masses in the Fourth Dimension
Kazimir Malevich,masses,Painterly Realism of a Boy with a Knapsack - Color Masses in the Fourth Dimension
Kazimir Malevich,pails,Woman with Pails: Dynamic Arrangement
Kazimir Malevich,painterly,Painterly Realism of a Boy with a Knapsack - Color Masses in the Fourth Dimension
Kazimir Malevich,painting,Suprematist Painting
Kazimir Malevich,realism,Painterly Realism of a Boy with a Knapsack - Color Masses in the Fourth Dimension
Kazimir Malevich,reservist,Reservist of the First Division
Kazimir Malevich,samovar,Samovar
Kazimir Malevich,suprematist,Suprematist Composition: Airplane Flying
Kazimir Malevich,suprematist,Suprematist Composition: White on White
Kazimir Malevich,suprematist,Suprematist Painting
Kazimir Malevich,white,Suprematist Composition: White on White
Kazimir Malevich,woman,Woman with Pails: Dynamic Arrangement{Title Words, Artist} distribution
What title words used often by artists?display(slpitTitleData.groupBy("titleWord").count.orderBy('count.desc,'titleWord))
titleWord,count
life,16
still,16
woman,15
composition,14
portrait,12
bather,7
blue,7
red,7
guitar,5
landscape,5
white,5display(slpitTitleData.select("Artist","titleWord").distinct.
groupBy("titleWord").count.orderBy('count.desc,'titleWord))
titleWord,count
portrait,9
life,6
still,6
landscape,5
woman,5
bather,4
self,4
white,4
bird,3
blue,3
boy,3
composition,3
dish,3
fruit,3
interior,3
night,3
painting,3
red,3
studio,3
table,3
three,3Build a Knowledge Graph
To show a different look at data we will build a knowledge graph as connections between artists, title words and years when paintings were created:
val artistYearWordData=slpitTitleData.select("Artist","lastYear","titleWord").
  toDF("artist","createdYear","titleWord")
val columnList=artistYearWordData.columns

columnList: Array[String] = Array(artist, createdYear, titleWord)var graphNodes: DataFrame =Seq(("","")).toDF("id","nodeType")
var graphEdges: DataFrame =Seq(("","","")).toDF("src","dst","edgeType")
var idx=0
for (columnx <- columnList) {
var idy=0
graphNodes=graphNodes.union(artistYearWordData.select(columnx).
withColumn("nodeType",lit(columnx)))
for (columny <- columnList) {
graphEdges=graphEdges.union(artistYearWordData.
select(artistYearWordData.columns(idx),columny).
toDF("src","dst").withColumn("edgeType",lit(columny))).distinct
idy=idy+1
}
idx=idx+1
}val graphNodesArtistYearWord=graphNodes.filter('id=!="").distinct
val graphEdgesArtistYearWord=graphEdges.filter('src=!="").
filter('dst=!="").filter('src=!='dst).distinct
val graphArtistYearWord = GraphFrame(graphNodesArtistYearWord,graphEdgesArtistYearWord)
Generic Function to Transform Table to Knowledge Graph
We will combine these steps and create a function that builds a knowledge graph based on all possible column pairs in the table. This function will work for any DataFrame table.def table2graph(table: DataFrame): GraphFrame = {
var graphNodes: DataFrame =Seq(("","")).toDF("id","nodeType")
var graphEdges: DataFrame =Seq(("","","")).toDF("src","dst","edgeType")
var idx=0
val columnList=table.columns
for (columnx <- columnList) {
var idy=0
graphNodes=graphNodes.union(table.select(columnx).withColumn("nodeType",lit(columnx)))
for (columny <- columnList) {
graphEdges=graphEdges.union(table.select(table.columns(idx),columny).
toDF("src","dst").withColumn("edgeType",lit(columny))).distinct
idy=idy+1
}
idx=idx+1
}
GraphFrame(graphNodes.filter('id=!="").distinct,graphEdges.filter('src=!="").filter('dst=!="").filter('src=!='dst).distinct)
}val graphArtistYearWord=table2graph(slpitTitleData.
select("Artist","lastYear","titleWord").
toDF("artist","createdYear","titleWord"))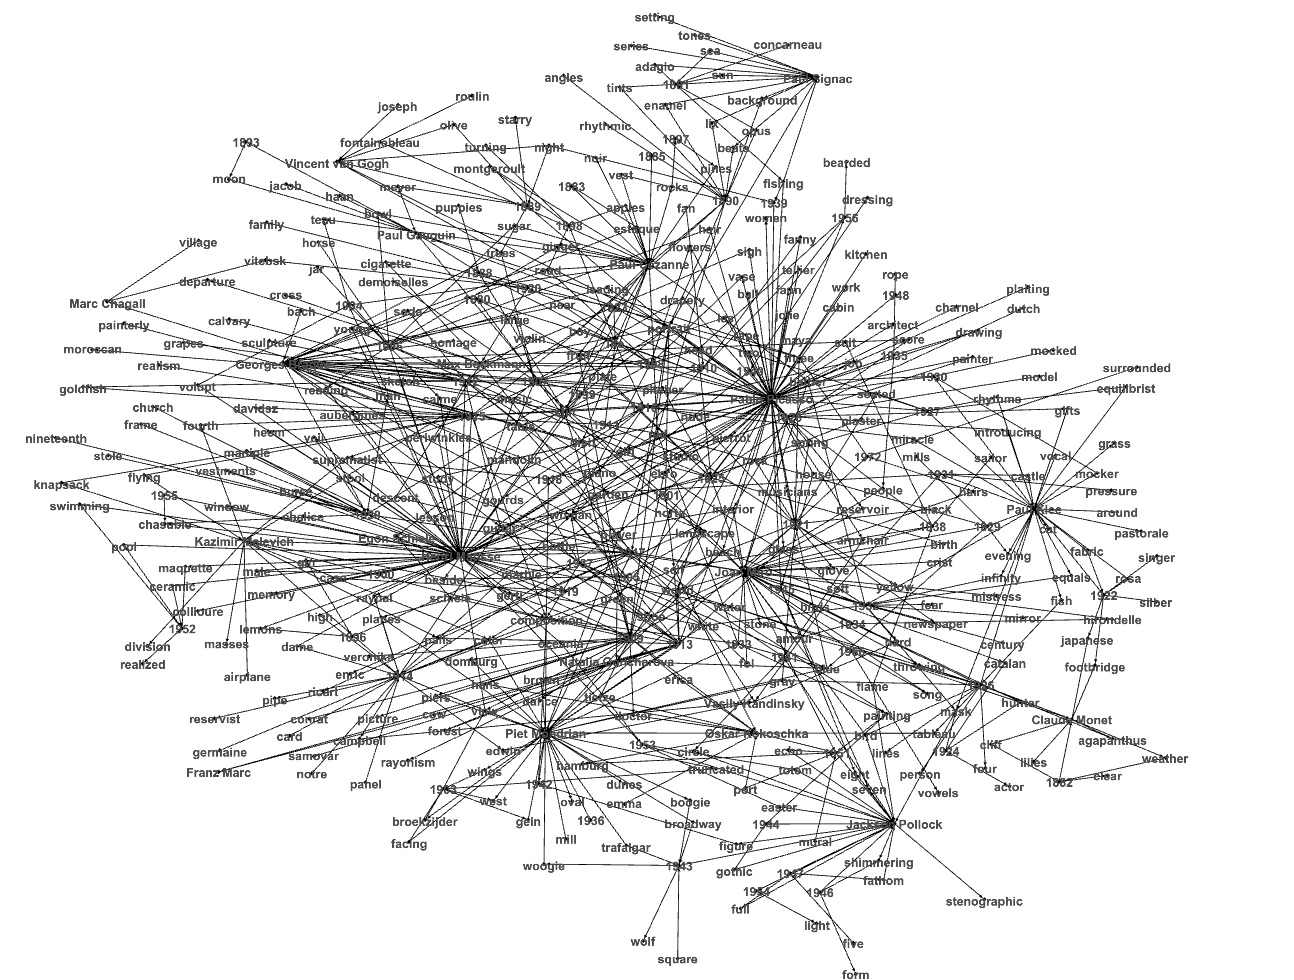
Subgraphs around Hubs
To show subgraph around graph hubs, first we will find high degree nodes, next we will find neighbors of hubs.val degrees = graphArtistYearWord.degrees
display(degrees.orderBy(desc("degree")))
Pablo Picasso,232
Henri Matisse,188
Joan Miró,126
Piet Mondrian,92
Jackson Pollock,76
Paul Klee,76
1909,74
Georges Braque,64
1914,64
Paul Cézanne,62
1913,54
Kazimir Malevich,54
1915,52
1906,44
1912,44
1950,42
Paul Signac,42
still,42
life,42
1921,40
portrait,40
1917,40def graph2dot(graph: GraphFrame): DataFrame = {
graph.edges.distinct.
map(s=>("\""+s(0).toString +"\" -> \""
+s(1).toString +"\""+" [label=\""+(s(2).toString)+"\"];")).
toDF("dotLine")
}
val dotlineArtistYearWord=graph2dot(graphArtistYearWord)display(dotlineArtistYearWord.filter('dotLine.rlike("Piet Mondrian")))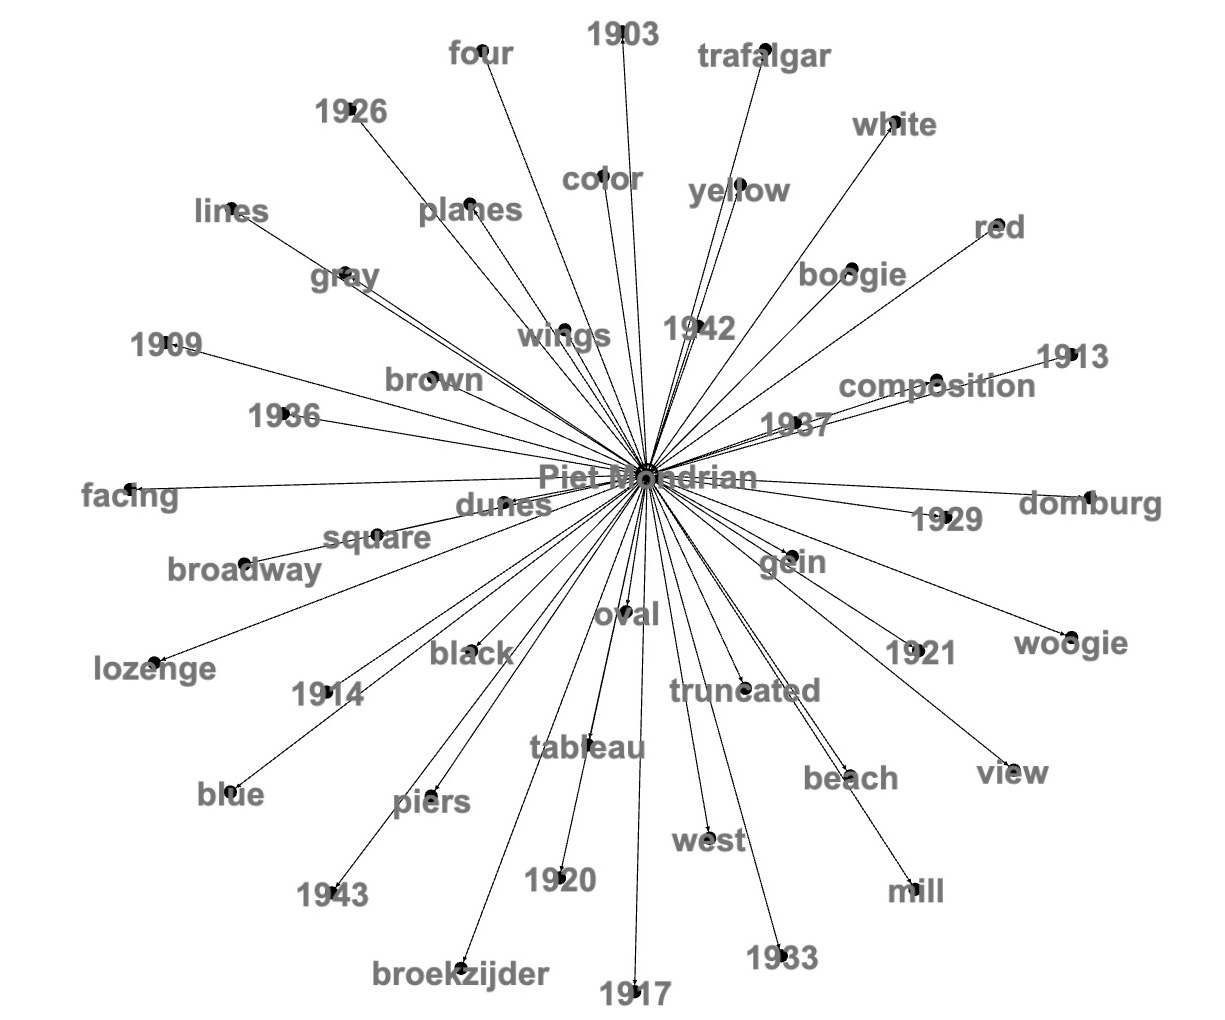 Example 2: Neighbor nodes of year 1909:
display(dotlineArtistYearWord.filter('dotLine.rlike("1909")))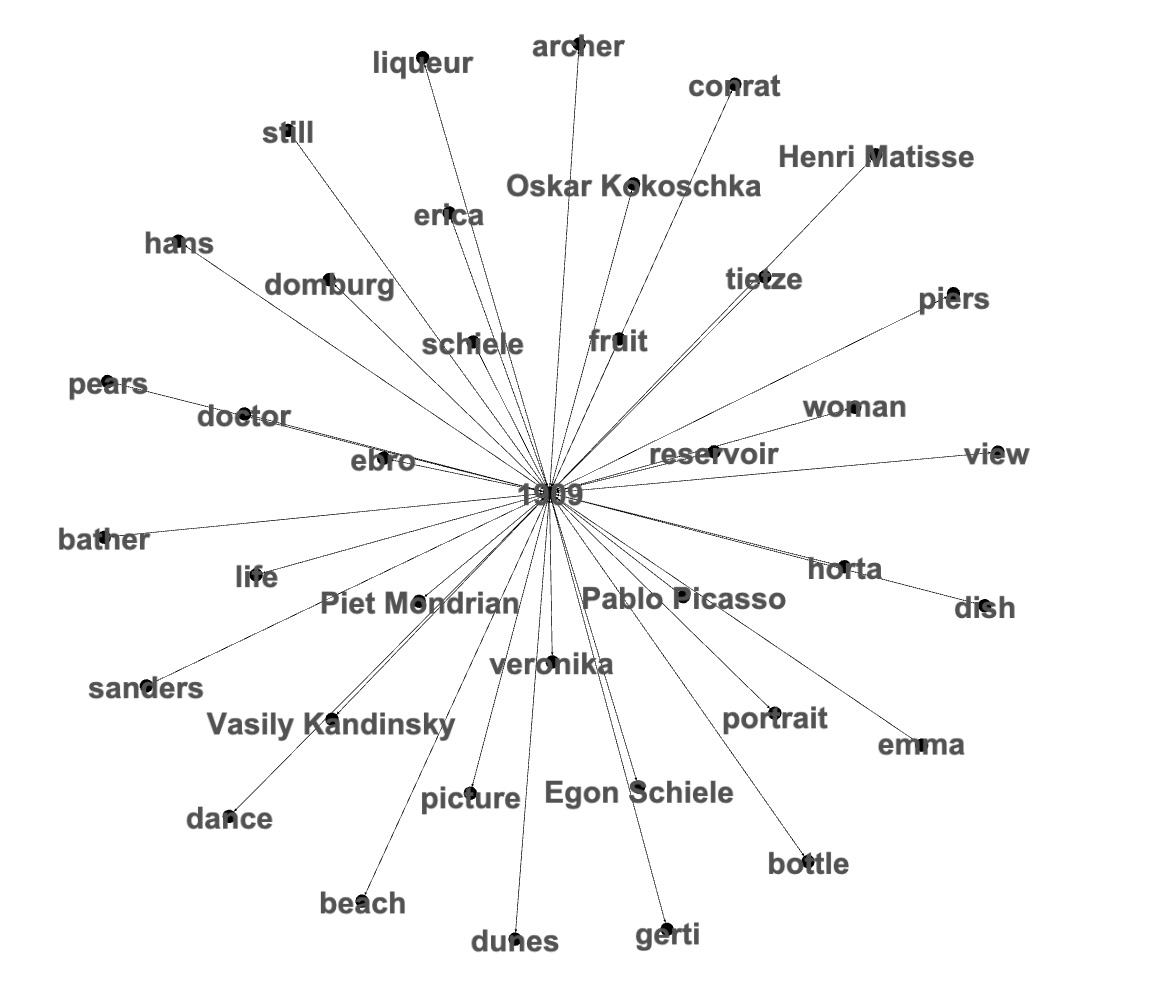 Example 3: Neighbors of title word: "portrait"
display(dotlineArtistYearWord.filter('dotLine.rlike("portrait")))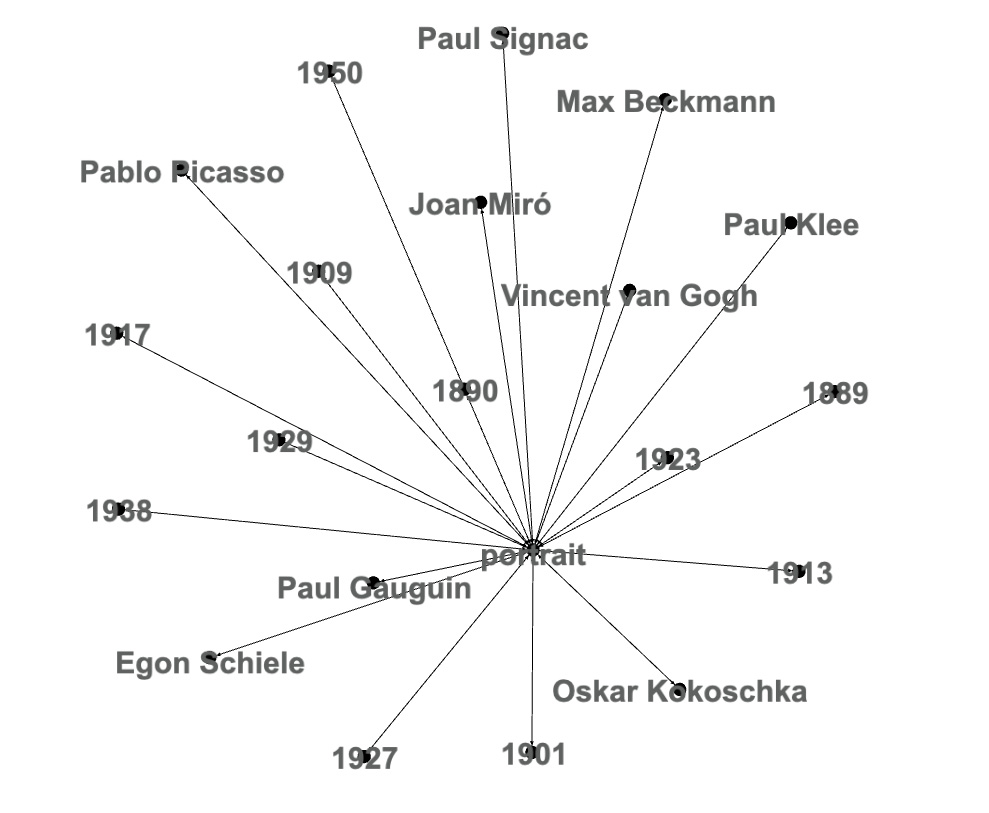 Example 4: Title word: "life"
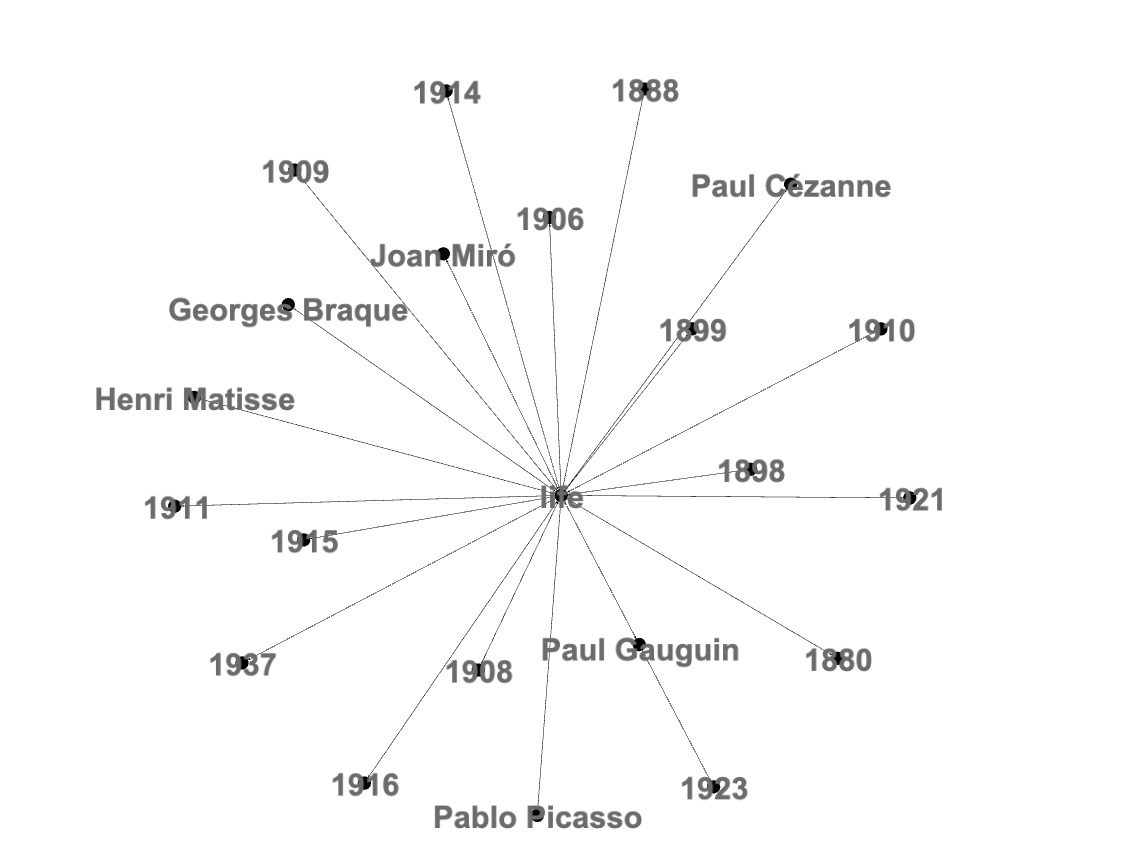 Example 5: Title word: "still"
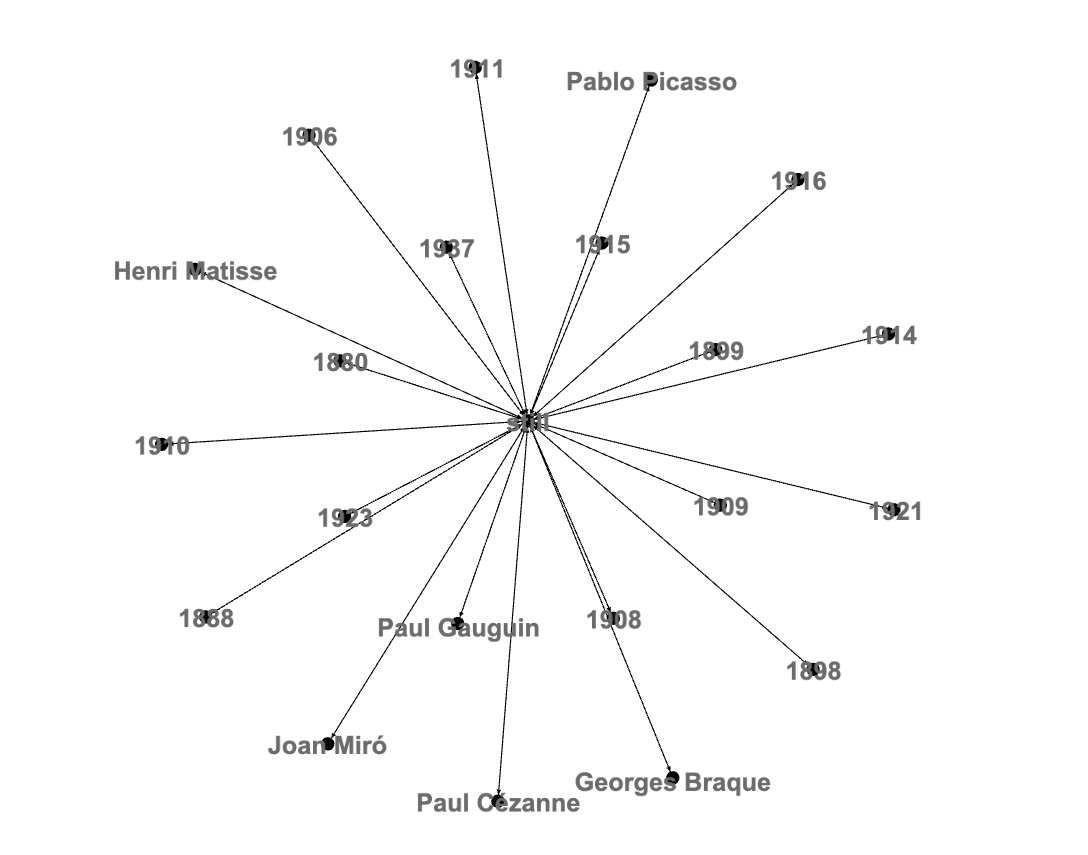
Semantic Connections between Title Words
Graphs around title words 'still' and 'life' look very similar: probably most of these words came from 'still life' related titles. To see how 'still' and 'life' are connected we will combine their dot lines:display(dotlineArtistYearWord.filter('dotLine.rlike("life") || 'dotLine.rlike("still")))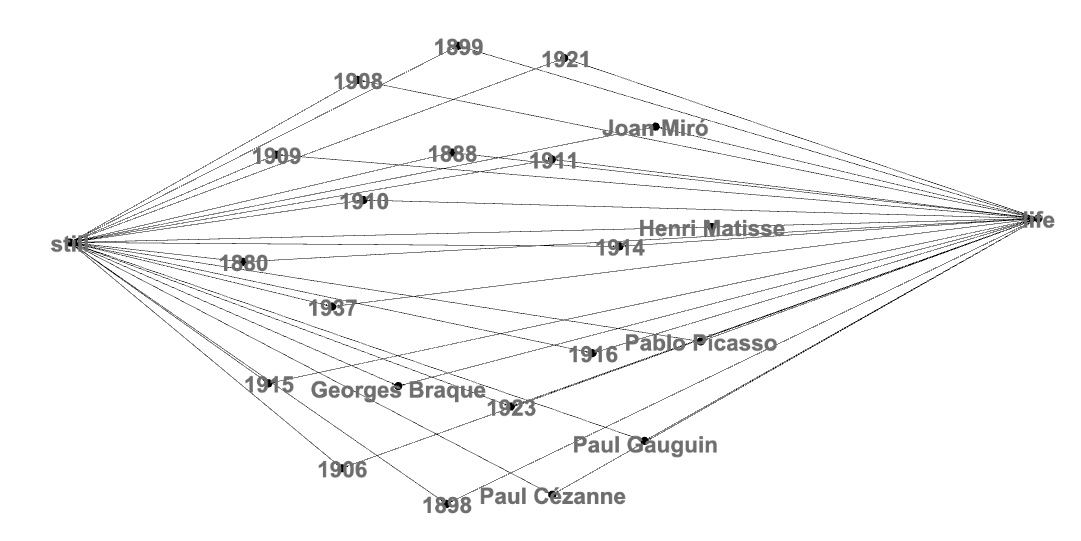
Artists, 'still life' painting titles and years when paintings were created:
display(slpitTitleData.filter(lower('Title).contains("still life")).
  select("Artist","Title","lastYear").
  distinct.orderBy("Artist","lastYear","Title"))

  Georges Braque,The Table (Still Life with Fan),1910
  Henri Matisse,Still Life,1899
  Henri Matisse,Still Life with Aubergines,1911
  Henri Matisse,"""Still Life after Jan Davidsz. de Heem's """"La Desserte""""""",1915
  Joan Miró,Still Life -- Glove and Newspaper,1921
  Joan Miró,Still Life I,1923
  Joan Miró,Still Life II,1923
  Joan Miró,Still Life with Old Shoe,1937
  Pablo Picasso,Still Life with Fruit and Glass,1908
  Pablo Picasso,Still Life with Liqueur Bottle,1909
  Pablo Picasso,Green Still Life,1914
  Pablo Picasso,"""Still Life: """"Job""""""",1916
  Paul Cézanne,Still Life with Fruit Dish,1880
  Paul Cézanne,Still Life with Apples,1898
  Paul Cézanne,"Still Life with Ginger Jar, Sugar Bowl, and Oranges",1906
  Paul Gauguin,Still Life with Three Puppies,1888
Connections between Artists
In 'Painting Titles Words Analysis' section we showed that based on painting titles styles of Paul Signac and Kazimir Malevich are very different. Now we will look at nodes around their names and see that Paul Signac and Kazimir Malevich did not have overlaps in time and in title words:display(dotlineArtistYearWord.
filter('dotLine.rlike("Paul Signac") || 'dotLine.rlike("Kazimir Malevich")))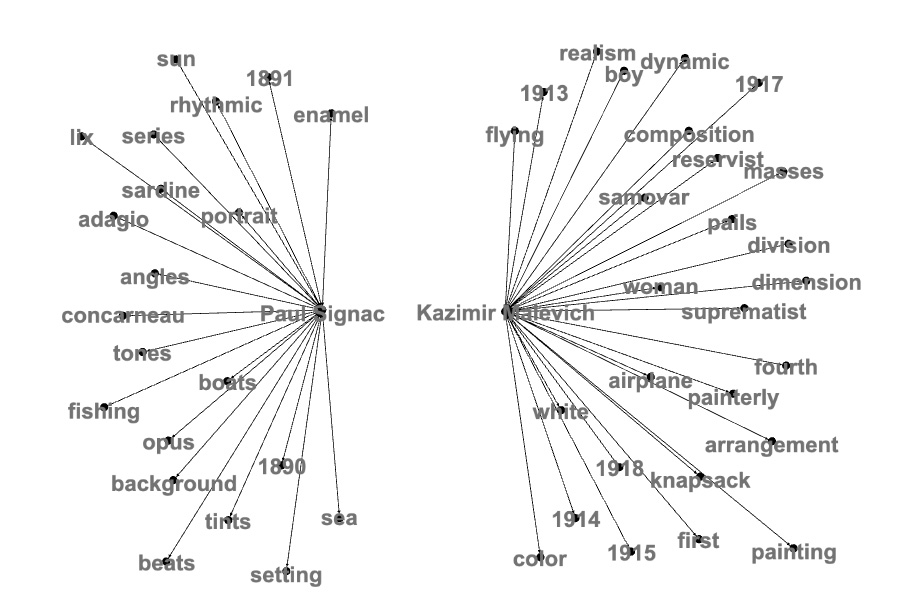 From some artist pairs you will expect high relationships. For example, let's look at connections between Pablo Picasso and George Braque both of whom started Cubism movement in 1907. Graph shows that Picasso and Braque have many connections via time and title words:
display(dotlineArtistYearWord.
  filter('dotLine.rlike("Georges Braque") || 'dotLine.rlike("Pablo Picasso")))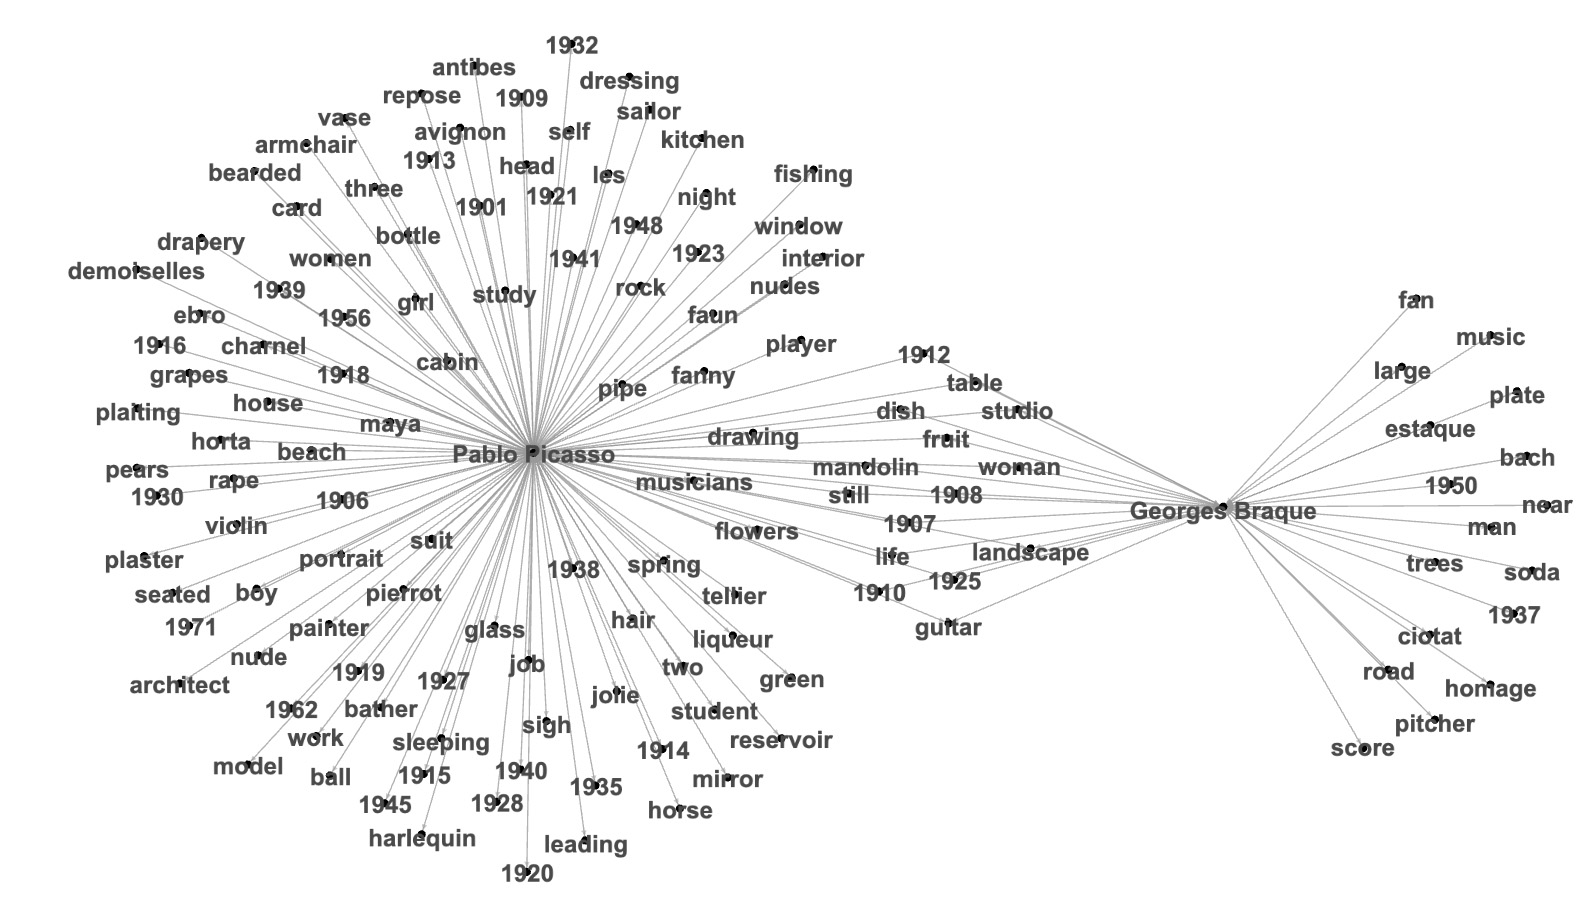
Using motif 'find' function is an elegant way to calculate weights of artists pair links:
val artistPairWeight=graphArtistYearWord.
  find("(a) - [ab] -> (b); (b) - [bc] -> (c)").
  filter($"a.id"=!=$"c.id").
  filter($"c.nodeType"==="artist" && $"a.nodeType"==="artist").
  map(s=>(s(0).toString.split("\\[")(1).split(",")(0),
  s(2).toString,s(4).toString.split("\\[")(1).split(",")(0))).
  toDF("artist1","link","artist2").
  groupBy("artist1","artist2").count.toDF("artist1","artist2","linkCount")

display(artistPairWeight.orderBy('linkCount.desc))
Pablo Picasso,Henri Matisse,23
Henri Matisse,Pablo Picasso,23
Joan Miró,Pablo Picasso,17
Pablo Picasso,Joan Miró,17
Pablo Picasso,Georges Braque,15
Georges Braque,Pablo Picasso,15
Georges Braque,Henri Matisse,10
Henri Matisse,Georges Braque,10
Henri Matisse,Joan Miró,9
Joan Miró,Henri Matisse,9
Henri Matisse,Piet Mondrian,8
Piet Mondrian,Henri Matisse,8
Joan Miró,Georges Braque,8
Georges Braque,Joan Miró,8
Joan Miró,Paul Klee,7
Pablo Picasso,Paul Cézanne,7
Paul Klee,Joan Miró,7
Paul Cézanne,Pablo Picasso,7
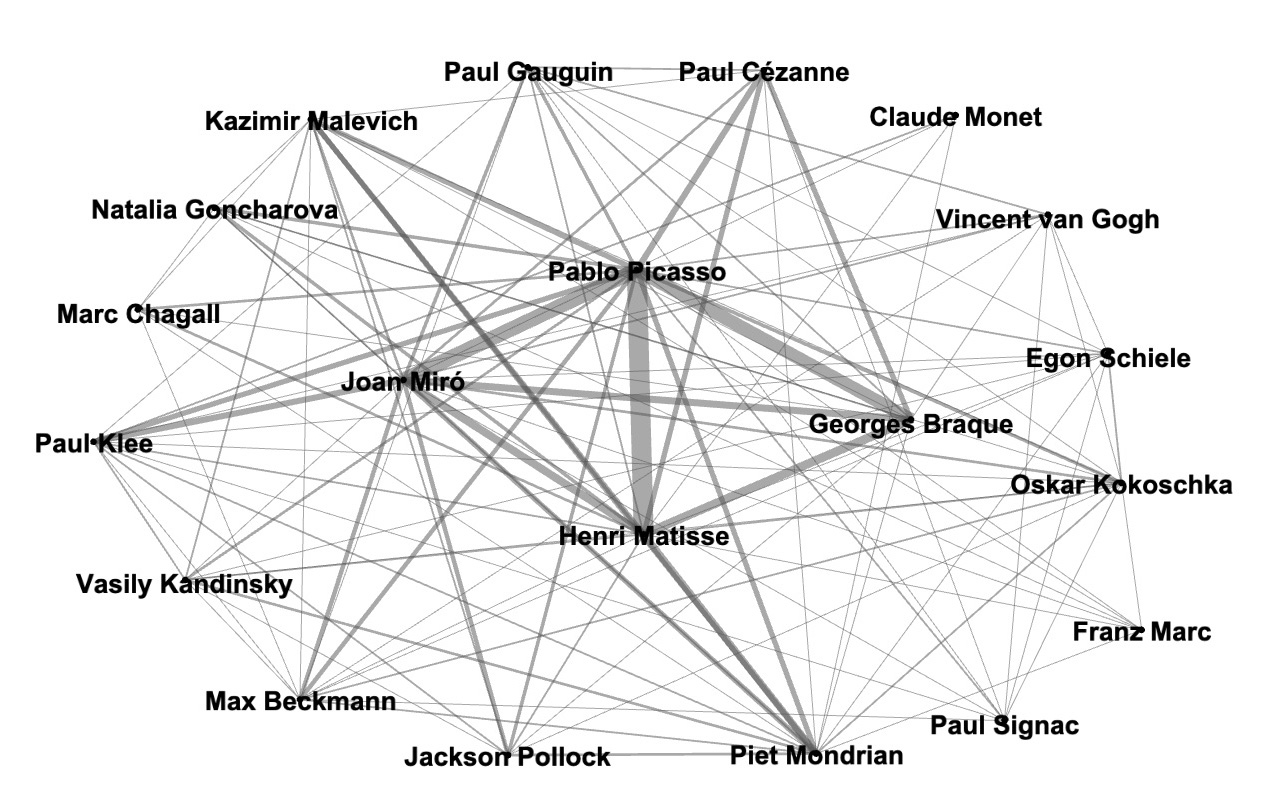
To show weights of artist links we will slightly change the code of transforming connections to DOT language:
display(artistPairWeight.map(s=>("\""+s(0).toString +"\" -> \""
  +s(1).toString +"\""+"[label=\""
  +(s(2).toString) +"\",weight=\""
  +(s(2).toString) + "\"];")))

  "Pablo Picasso" -> "Kazimir Malevich" [label="6" , weight="6"];
  "Henri Matisse" -> "Georges Braque" [label="10" , weight="10"];
  "Jackson Pollock" -> "Pablo Picasso" [label="4" , weight="4"];
  "Henri Matisse" -> "Natalia Goncharova" [label="4" , weight="4"];
  "Henri Matisse" -> "Pablo Picasso" [label="23" , weight="23"];
  "Georges Braque" -> "Paul Cézanne" [label="6" , weight="6"];
  "Piet Mondrian" -> "Vasily Kandinsky" [label="3" , weight="3"];
  "Pablo Picasso" -> "Georges Braque" [label="15" , weight="15"];
  "Kazimir Malevich" -> "Pablo Picasso" [label="6" , weight="6"];
  "Pablo Picasso" -> "Henri Matisse" [label="23" , weight="23"];
  "Marc Chagall" -> "Pablo Picasso" [label="3" , weight="3"];
  "Piet Mondrian" -> "Henri Matisse" [label="8" , weight="8"];
  "Henri Matisse" -> "Kazimir Malevich" [label="6" , weight="6"];
  "Joan Miró" -> "Oskar Kokoschka" [label="3" , weight="3"];
  "Georges Braque" -> "Pablo Picasso" [label="15" , weight="15"];
  "Pablo Picasso" -> "Joan Miró" [label="17" , weight="17"];
  "Paul Klee" -> "Joan Miró" [label="7" , weight="7"];
  "Paul Cézanne" -> "Pablo Picasso" [label="7" , weight="7"];
Time when Paintings were Created
Some pairs of years that are far from each other, represent different periods of art and not connected at all:
display(dotlineArtistYearWord.filter('dotLine.rlike("1890") || 'dotLine.rlike("1912")))
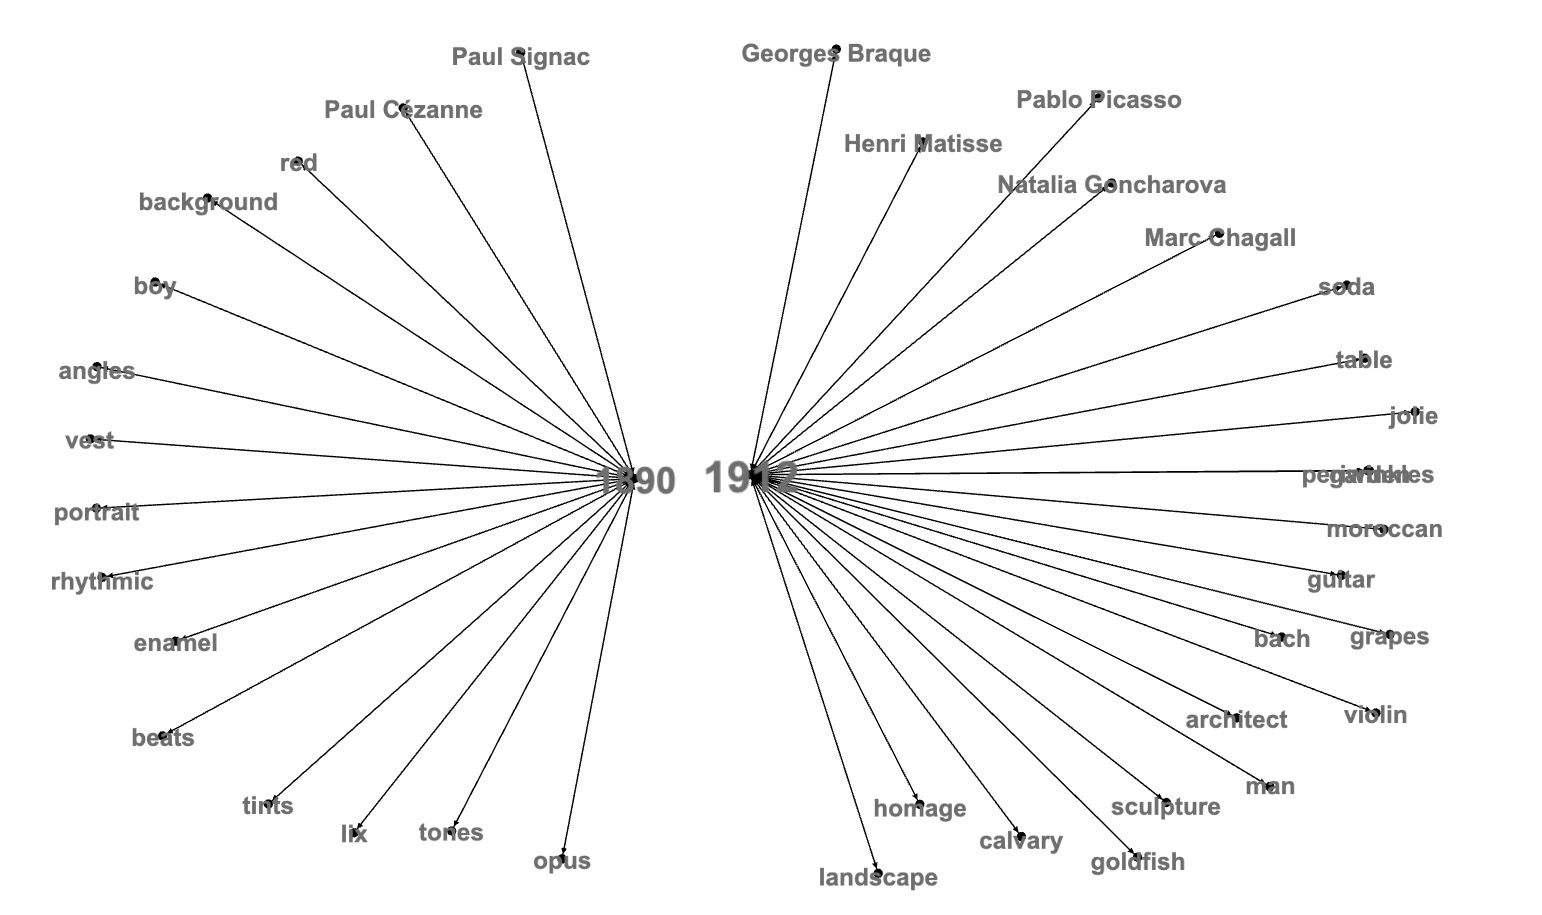
Some years are next to each other and highly connected:
display(dotlineArtistYearWord.filter('dotLine.rlike("1913") || 'dotLine.rlike("1914")))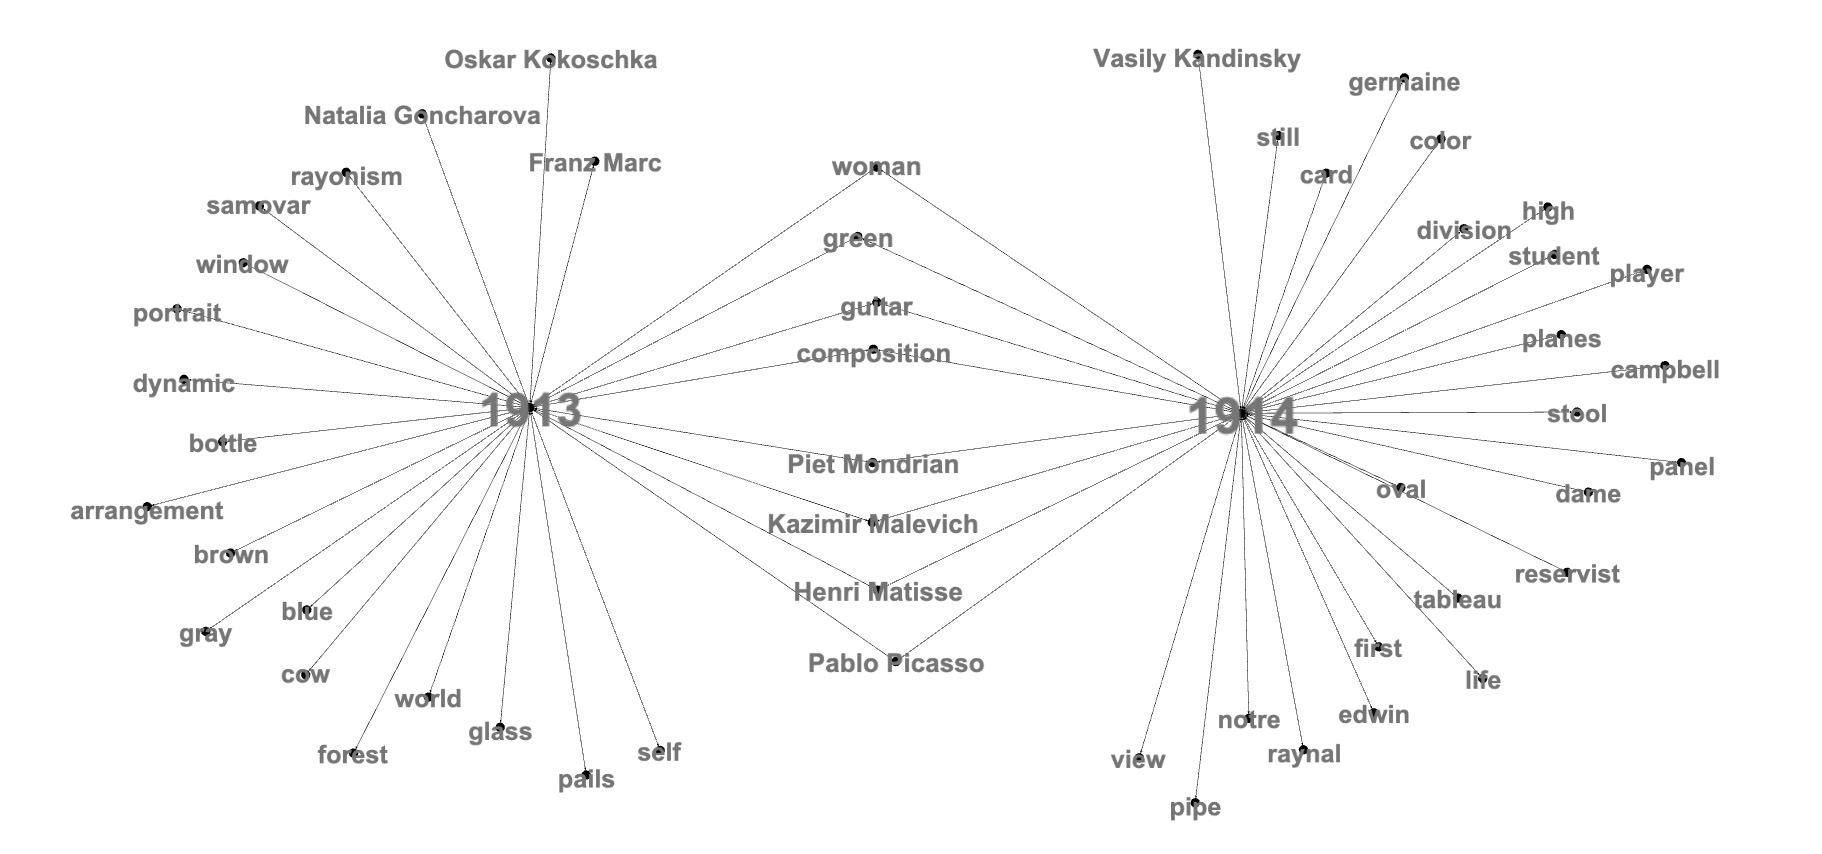
Graph for Artists and Time
We will build {Artist, Year} graph with only two types of nodes - Artists and Painting Years:val graphArtistYear=table2graph(slpitTitleData.
select("Artist","lastYear").
toDF("artist","createdYear"))display(graph2dot(graphArtistYear).
filter('dotLine.rlike("Pablo Picasso")))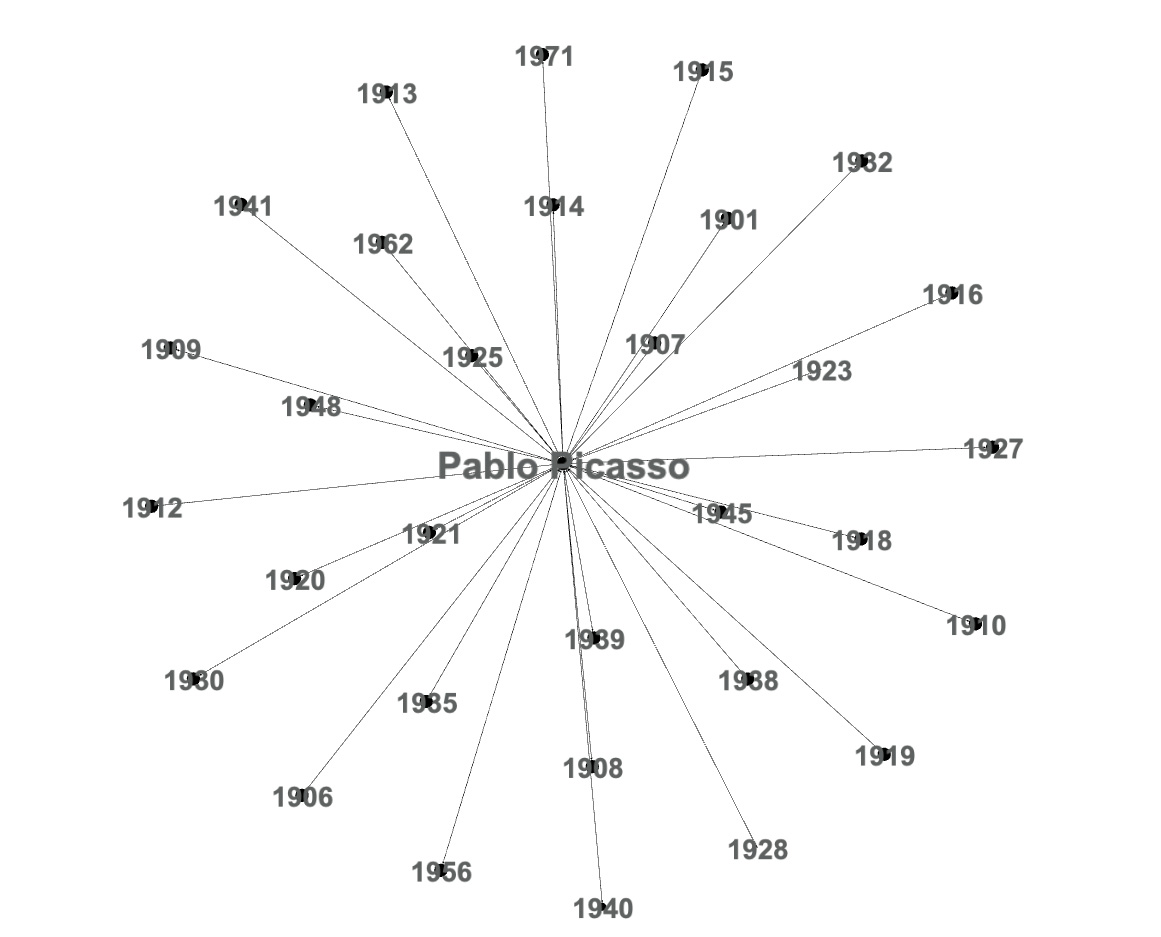 Artists with paintings of years 1913 or 1914:
display(graph2dot(graphArtistYear).
filter('dotLine.rlike("1913")|| 'dotLine.rlike("1914")))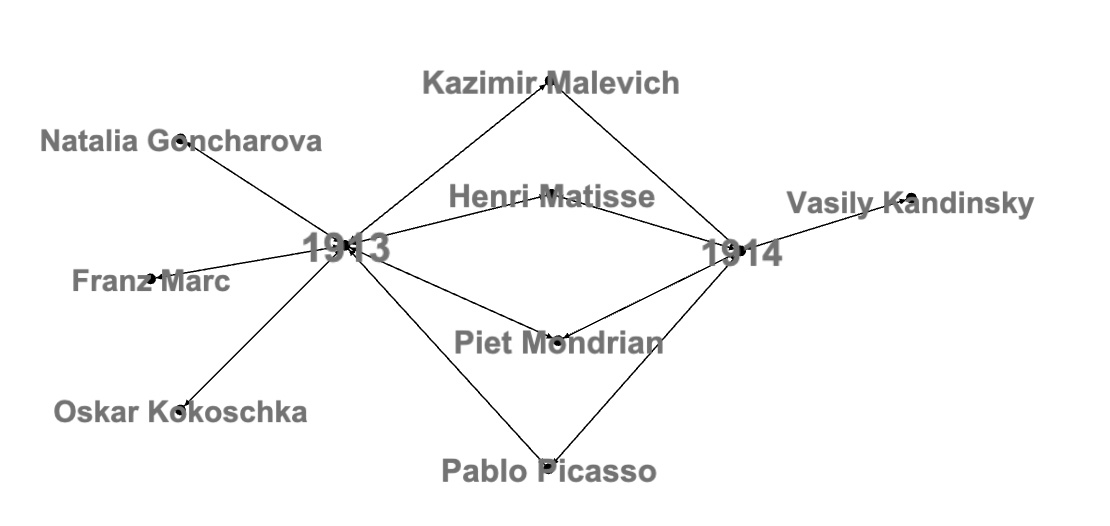 To simlify dot language filtering queries we will slightly modify graph2dot function:
def edge2dot(graph: GraphFrame): DataFrame = {
  graph.edges.distinct.
    map(s=>("\""+s(0).toString +"\" -> \""
      +s(1).toString +"\""+" [label=\""+(s(2).toString)+"\"];",
      s(0).toString , s(1).toString)).
      toDF("dotLine","node1","node2")
}display(edge2dot(graphArtistYear).
filter(('node1>="1932" && 'node1 <="1938")||
('node2>="1932" && 'node2 <="1938")).select("dotLine"))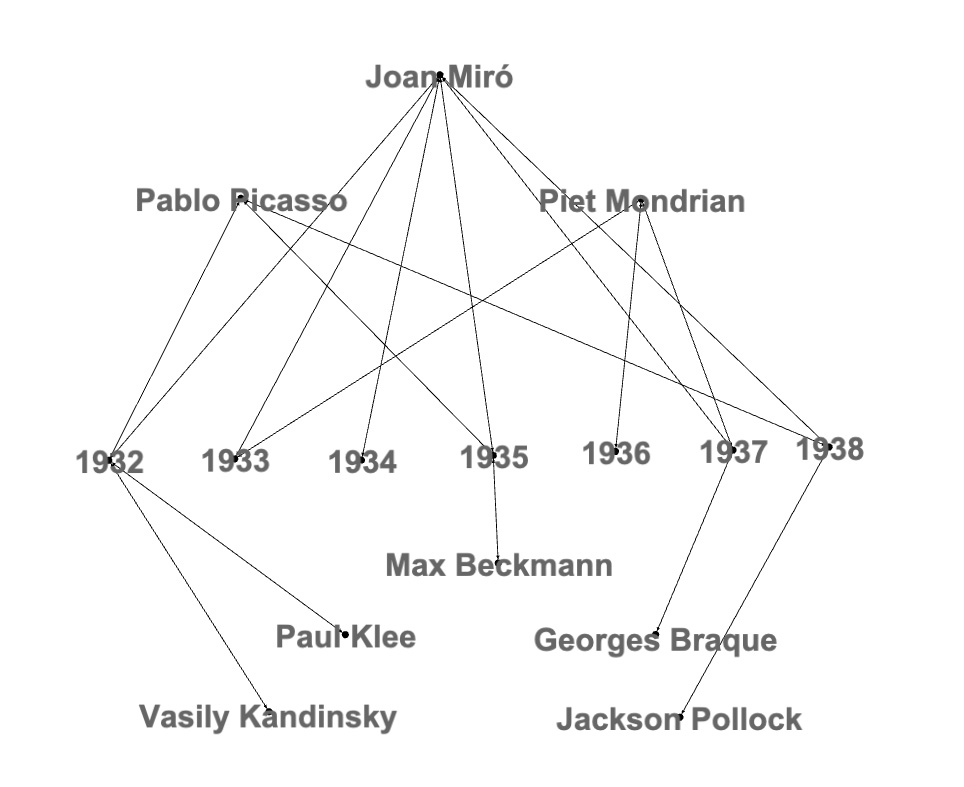 Painting period [1912, 1917]:
display(edge2dot(graphArtistYear).
filter(('node1>="1912" && 'node1 <="1917")||
('node2>="1912" && 'node2 <="1917")).select("dotLine"))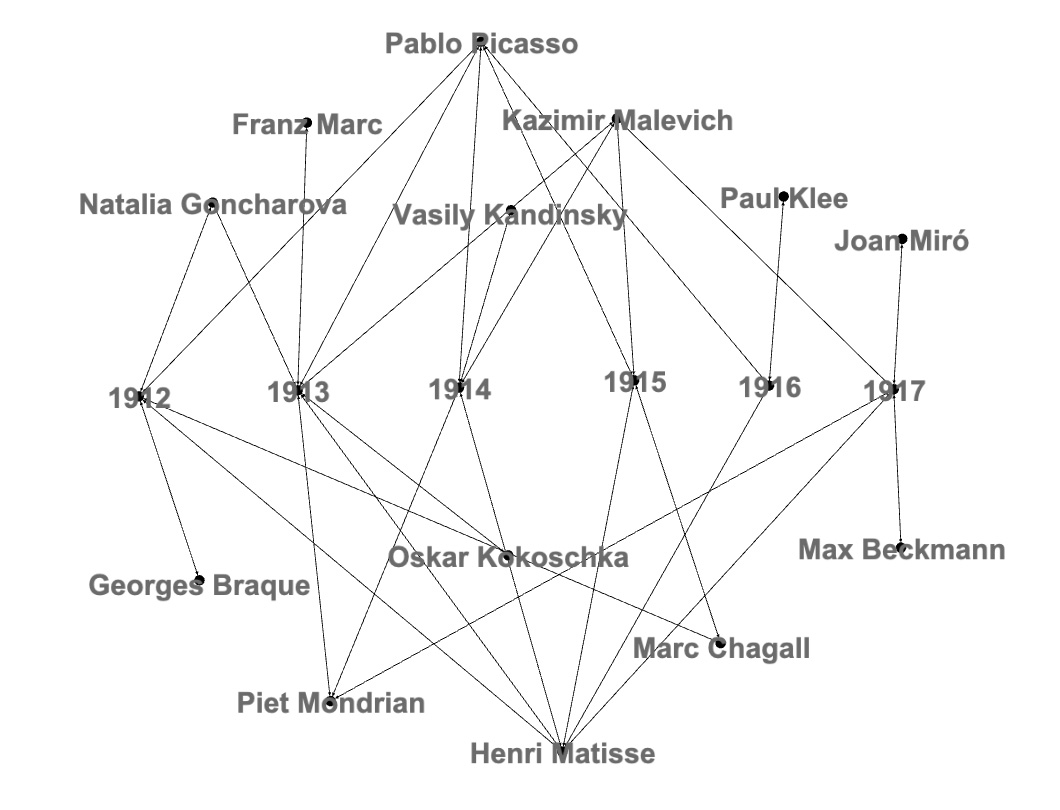 Two painting periods [1903, 1908] and [1933, 1938]:
display(edge2dot(graphArtistYear).
  filter((('node1>="1933" && 'node1 <="1938")||( 'node2>="1933" && 'node2 <="1938"))||
  (('node1>="1903" && 'node1 <="1908")||( 'node2>="1903" && 'node2 <="1908"))).select("dotLine"))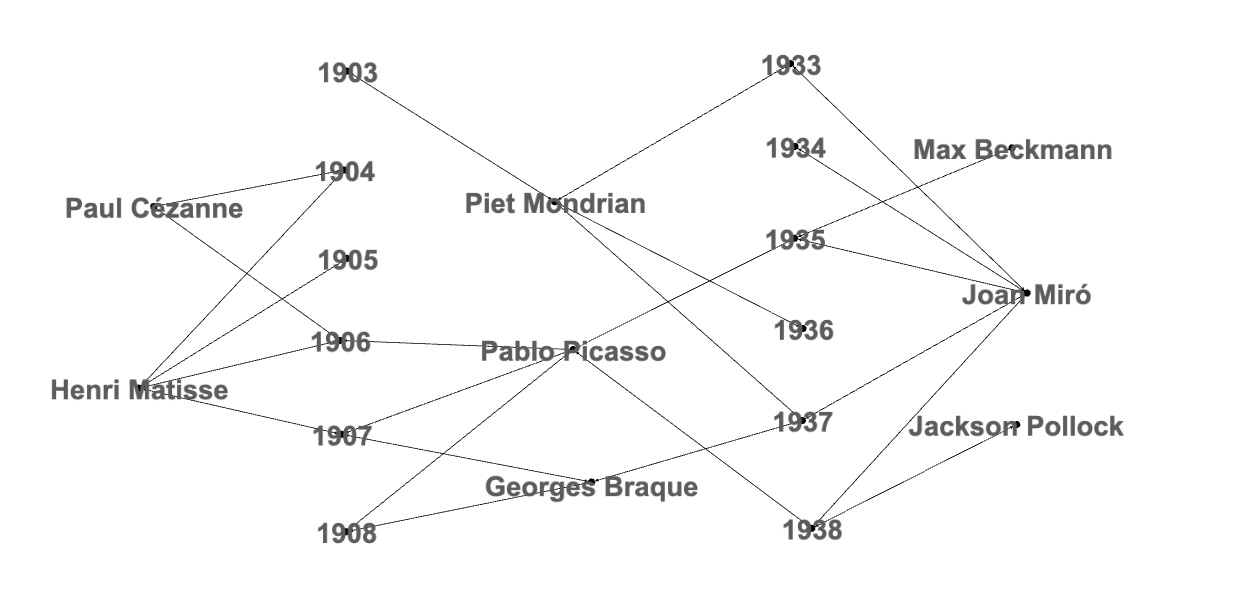
Graph for Artists and Title Words
We will build {Artist, Title Word} graph with two types of nodes - Artist and Title Words:val graphArtistWord=table2graph(slpitTitleData.
select("Artist","titleWord").toDF("artist","titleWord"))display(graph2dot(graphArtistWord).filter('dotLine.rlike("Piet Mondrian")))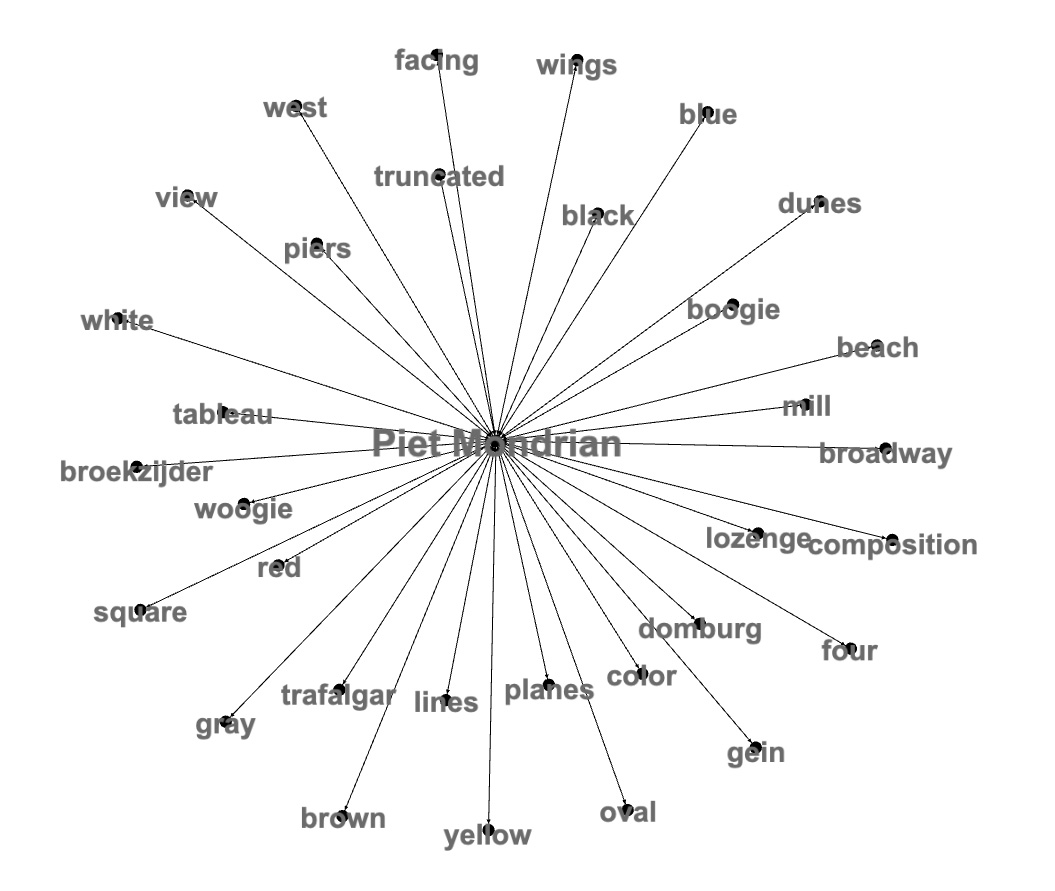 Piet Mondrian had a lot of color title words. Who else mentioned colors in their painting titles?
display(edge2dot(graphArtistWord).
filter('node1.isin("blue","red","white","black","yellow","green","brown","gray" )||
( 'node2.isin("blue" ,"red","white","black","yellow","green","brown","gray" ))).select("dotLine"))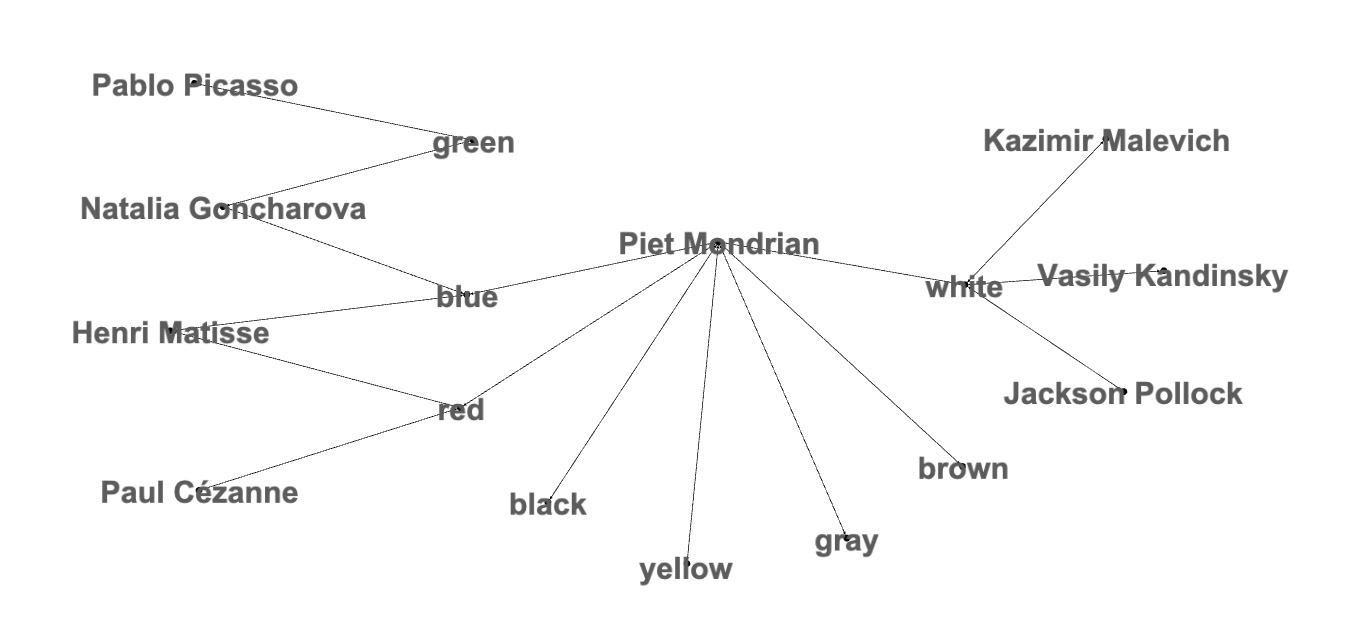 It's a lot of overlaps between title words of Paul Cézanne and Georges Braque. Was it because Paul Cézanne influenced Cubism movement?
display(edge2dot(graphArtistWord).
  filter('node1.isin("Paul Cézanne","Georges Braque" )||
          ( 'node2.isin("Paul Cézanne","Georges Braque" ))).select("dotLine"))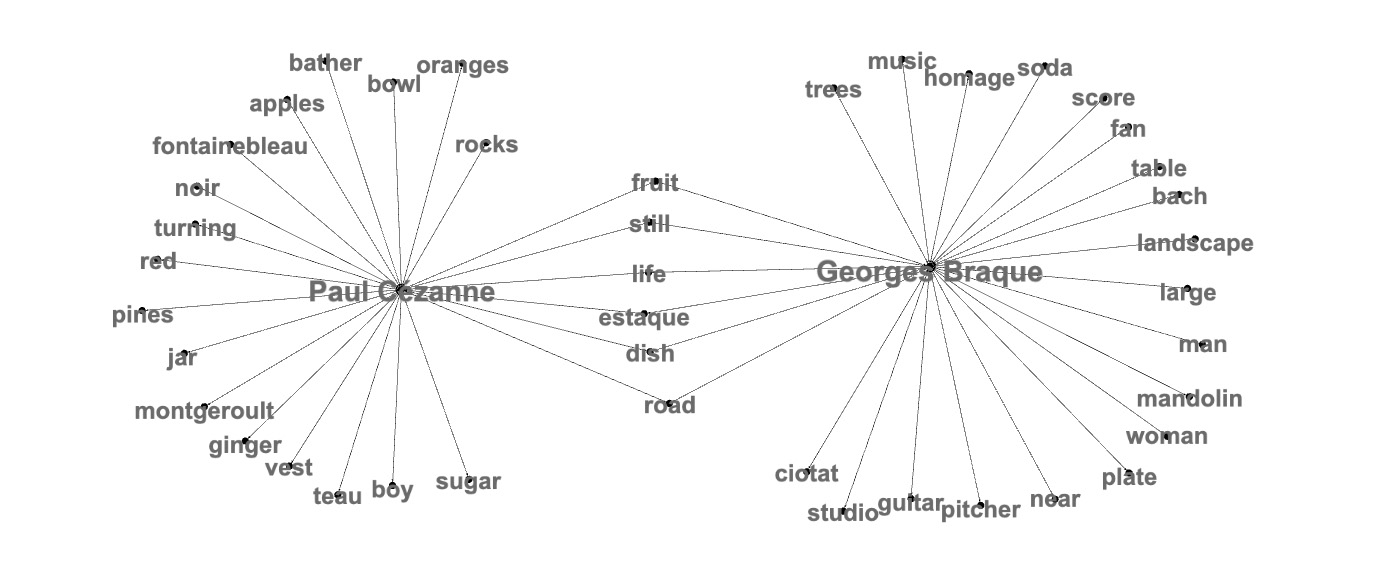
Graph for Title Words and Time
{Title Word, Year} graph with two types of nodes - Title Words and Painting Years:val graphArtistYear=table2graph(slpitTitleData.
select("Artist","lastYear").
toDF("artist","createdYear"))display(edge2dot(graphYearWord).
filter('node1.isin("blue","red","white","black","yellow","green","brown","gray" )||
( 'node2.isin("blue" ,"red","white","black","yellow","green","brown","gray" ))).select("dotLine"))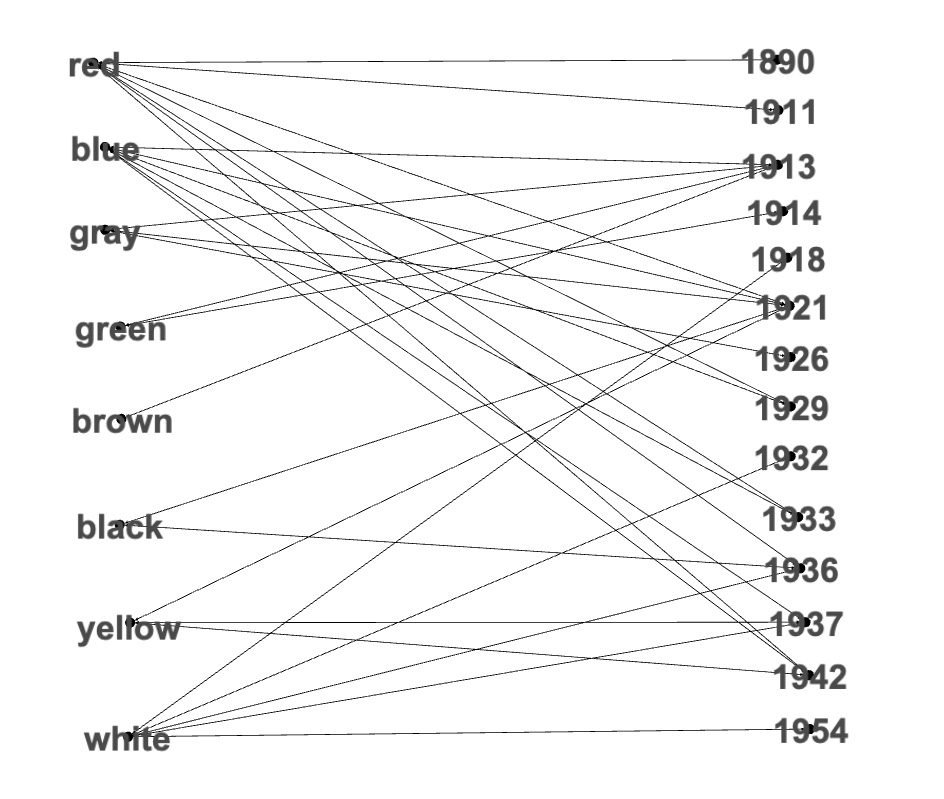 Title words in painting years period [1929, 1932]:
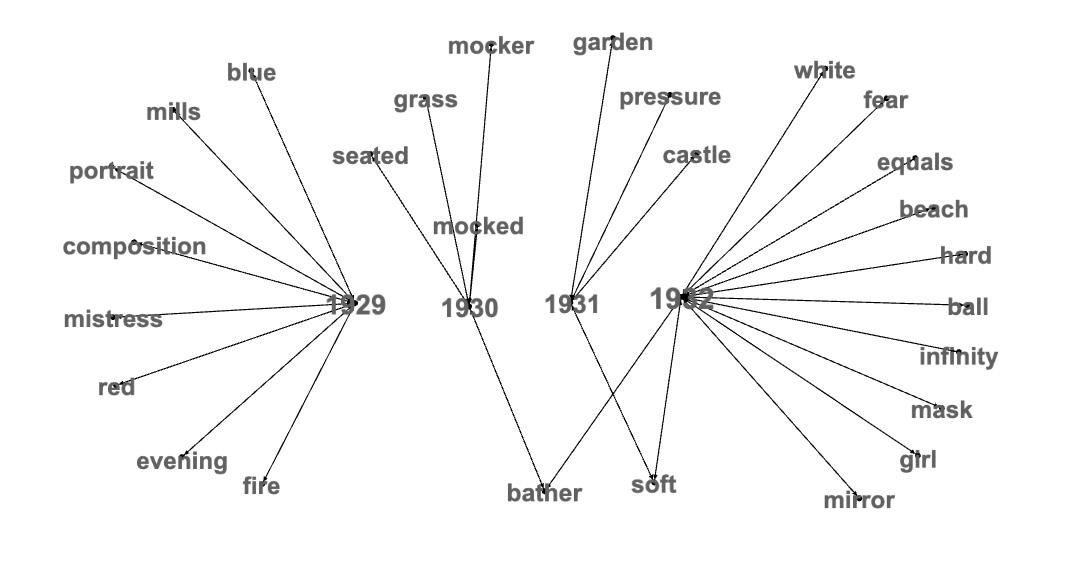
display(edge2dot(graphYearWord).
  filter((('node1>="1929" && 'node1 <="1932")||( 'node2>="1929" && 'node2 <="1932"))).select("dotLine"))