Read Word Pairs Graph
In one of previous posts we built and saved Word2Vec2Graph for pair of words of Stress Data file. In this post we will look for topics of the Stress Data file.
Read stored vertices and edges and rebuilt the graph:
import org.graphframes.GraphFrame
import org.graphframes.GraphFrame
val graphNgramStressVertices = sqlContext.read.parquet("graphNgramVertices")
val graphNgramStressEdges = sqlContext.read.parquet("graphNgramEdges")
val graphNgramStress = GraphFrame(graphNgramStressVertices, graphNgramStressEdges)
Connected Components with Cosine Similarity Thresholds
In the previous post we showed that in the graph of all word pairs, almost all pairs are connected within the same large connected component. To find topics in that post we used Label Propagation algorithm. In this post we will look at connected components with thresholds on Word2Vec cosine similarity.As input parameters in this function we will use: graph vertices and edges, minimum and maximum of edge weight and minimum and maximum of connected component sizes.
import org.apache.spark.sql.DataFrame
def w2v2gConnectedComponents(graphVertices: DataFrame, graphEdges: DataFrame,
     cosineMin: Double, cosineMax: Double,
     ccMin: Int, ccMax: Int):
  DataFrame = {
  val graphEdgesSub= graphEdges.filter('edgeWeight>cosineMin).filter('edgeWeight<cosineMax)
  val graphSub = GraphFrame(graphVertices, graphEdgesSub)
  sc.setCheckpointDir("/FileStore/")
  val resultCC = graphSub.
     connectedComponents.
     run()
  val resultCCcount=resultCC.
     groupBy("component").
     count.
     toDF("cc","ccCt")
 val sizeCC=resultCC.join(resultCCcount,'component==='cc).
     filter('ccCt<ccMax).filter('ccCt>ccMin).
     select("id","component","ccCt").distinct
 graphEdges.join(sizeCC,'src==='id).
     union(graphEdges.join(sizeCC,'dst==='id)).
     select("component","ccCt","src","dst","edgeWeight").distinct
}
As output of this function we are getting DataFrame with connected component identifiers, connected component sizes, and source, target and weight of edges. Example:
val result=w2v2gConnectedComponents(graphNgramStressVertices,
  graphNgramStressEdges,0.5,1.0,4,30)
result.persist

display(result.orderBy('component).limit(10))
component,ccCt,src,dst,edgeWeight
8589934598,5,effect,mental,0.019197841854283394
8589934598,5,negative,event,-0.1545046492202531
8589934598,5,dictate,effect,0.38921675236752246
8589934598,5,impact,effect,0.5603950362283256
8589934598,5,positive,affect,0.19312906545029415
8589934598,5,negative,counterproductive,0.4585309254797448
8589934598,5,negatively,impact,0.6222451350552916
8589934598,5,effect,social,-0.09071914329524373
8589934598,5,increasing,positive,0.39817338998452684
8589934598,5,either,positive,0.14172399395894802
Transform to .DOT Language
We described in our previous post how to build graph on Gephi. This function creates a list of direct edges with labels on .DOT format. This function takes an output of the w2v2gConnectedComponents function, component id and minimum and maximum of edge weight:
def component2dot(graphComponents: DataFrame, componentId: Long,
  cosineMin: Double, cosineMax: Double): DataFrame = {
 graphComponents.
  filter('component===componentId).
  filter('edgeWeight>cosineMin).filter('edgeWeight<cosineMax).
  select("src","dst","edgeWeight").distinct.
  map(s=>("\""+s(0).toString +"\" -> \""
        +s(1).toString +"\""+" [label=\""+roundAt(2)(s(2).toString.toDouble)+"\"];")).
        toDF("dotLine")
}
This example is based on the the same parameters that we used to get an example of w2v2gConnectedComponents function:
val resultDot=component2dot(result,8589934598L,0.5,1.0)

display(resultDot)
"negatively" -> "impact" [label="0.62"];
"negative" -> "impact" [label="0.55"];
"impact" -> "effect" [label="0.56"];
"positive" -> "negative" [label="0.56"];
This topic does not look very interesting: is shows well known word connections. Now we will look at the results based on different thresholds.
How to Find Topics?
Do select potentially interesting connected components first we'll look at three most highly connected word pairs of all components. We will start with connected components based on word pairs with cosine similarity >0.5.
import org.apache.spark.sql.expressions.Window
import org.apache.spark.sql.functions._
val partitionWindow = Window.partitionBy($"component").orderBy($"edgeWeight".desc)
val result=w2v2gConnectedComponents(graphNgramStressVertices,graphNgramStressEdges,0.5,1.0,4,30)
val result2 = result.withColumn("rank", rank().over(partitionWindow))

display(result2.filter("rank<4").orderBy("component","rank"))
component,ccCt,src,dst,edgeWeight,rank
8589934598,5,negatively,impact,0.6222451350552916,1
8589934598,5,impact,effect,0.5603950362283256,2
8589934598,5,positive,negative,0.5554003154620236,3
103079215107,5,importance,understanding,0.698049637786647,1
103079215107,5,understanding,external,0.5310704126705637,2
103079215107,5,understanding,communicate,0.5114201442010496,3
146028888067,7,strategies,improve,0.6293635958167312,1
146028888067,7,strategies,techniques,0.5683039143777363,2
146028888067,7,communication,methods,0.5668162125661717,3
764504178688,7,levels,increase,0.5656564144629672,1
764504178688,7,higher,levels,0.563192594480148,2
764504178688,7,lower,levels,0.561116314190353,3
We will select connected component '146028888067' and run 'component2dot' function with different thresholds.
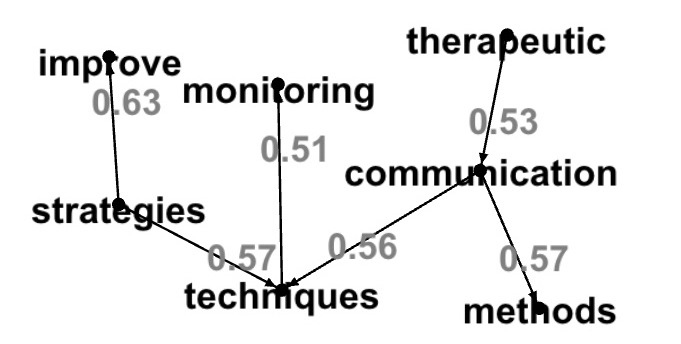
Word pairs with cosine similarity >0.5:
val resultDot=component2dot(result,146028888067L,0.5,1.0)

display(resultDot)
"communication" -> "methods" [label="0.57"];
"techniques" -> "monitoring" [label="0.51"];
"therapeutic" -> "communication" [label="0.53"];
"strategies" -> "improve" [label="0.63"];
"strategies" -> "techniques" [label="0.57"];
"communication" -> "techniques" [label="0.56"];
}
Here is the graph:
Word pairs with cosine similarity between 0.1 and 0.4:
val resultDot=component2dot(result,146028888067L,0.1,0.4)

display(resultDot)
"types" -> "communication" [label="0.37"];
"communication" -> "assertive" [label="0.38"];
"skill" -> "communication" [label="0.34"];
"therapeutic" -> "humor" [label="0.3"];
"common" -> "strategies" [label="0.15"];
"assertive" -> "communication" [label="0.38"];
"resentment" -> "communication" [label="0.3"];
"affect" -> "communication" [label="0.19"];
"improve" -> "stress" [label="0.39"];
"techniques" -> "different" [label="0.32"];
"relating" -> "methods" [label="0.38"];
"therapeutic" -> "important" [label="0.2"];
"allows" -> "communication" [label="0.35"];
"techniques" -> "include" [label="0.3"];
"communication" -> "requires" [label="0.35"];
"spectrum" -> "techniques" [label="0.37"];
"communication" -> "stress" [label="0.33"];
"communication" -> "difficulties" [label="0.31"];
"communication" -> "important" [label="0.15"];
"verbal" -> "communication" [label="0.22"];
"techniques" -> "traditionally" [label="0.39"];
"hinder" -> "communication" [label="0.31"];
"diminish" -> "communication" [label="0.37"];
"defines" -> "therapeutic" [label="0.18"];
"therapeutic" -> "value" [label="0.3"];
}
Here is the graph for these topics:
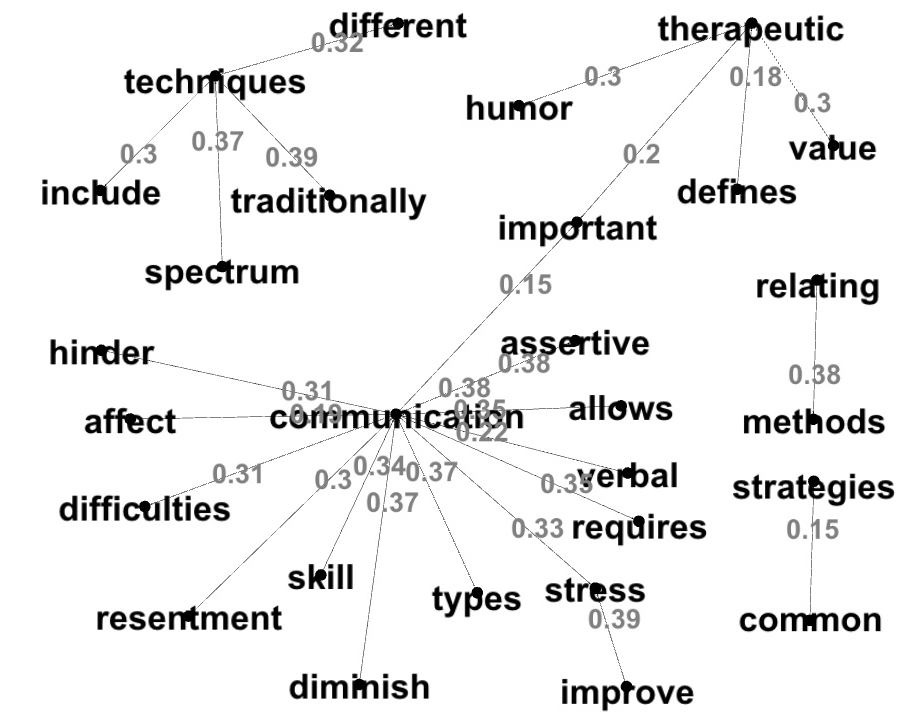
We can see in this graph that associations between word pairs with low cosine similarity give us more new ideas then word pairs with high cosine similarity. To find more new associations we will look at connected components based on word pairs with lower cosine similarity.
import org.apache.spark.sql.expressions.Window
import org.apache.spark.sql.functions._
val partitionWindow = Window.
   partitionBy($"component").
   orderBy($"edgeWeight".desc)
val result=w2v2gConnectedComponents(
   graphNgramStressVertices,graphNgramStressEdges,
   0.1,0.4,4,30)
result.persist
val result3edges = result.
   withColumn("rank", rank().over(partitionWindow))

display(result3edges.filter("rank<4").orderBy("component","rank"))
component,ccCt,src,dst,edgeWeight,rank
60129542144,6,psychological,disorders,0.5963055756093992,1
60129542144,6,stress,disorders,0.5028157528421987,2
60129542144,6,disorders,performed,0.3437520800691034,3
68719476739,5,create,relaxing,0.3524359789309395,1
68719476739,5,visualization,create,0.2846863145713592,2
68719476739,5,guided,imagery,0.2726519739627892,3
206158430208,5,physical,mental,0.6985440607130862,1
206158430208,5,adverse,consequences,0.5996755426245488,2
206158430208,5,consequences,stress,0.5891517529295102,3
214748364804,5,emotion,behaviour,0.436535207865593,1
214748364804,5,emotion,reflection,0.4204730414594547,2
214748364804,5,writing,express,0.281473311231902,3
549755813891,5,relieve,stress,0.465133494259944,1
549755813891,5,coping,laughter,0.45099090546448384,2
549755813891,5,laughter,humor,0.44800112141807397,3
We will start with connected component '68719476739' that has word pairs with lowest cosine similarities. Graph DOT lines with the same thresholds:
val resultDot1=component2dot(result,68719476739L,0.1,0.4)

display(resultDot1)
"imagery" -> "visualization" [label="0.21"];
"create" -> "relaxing" [label="0.35"];
"guided" -> "imagery" [label="0.27"];
"visualization" -> "create" [label="0.28"];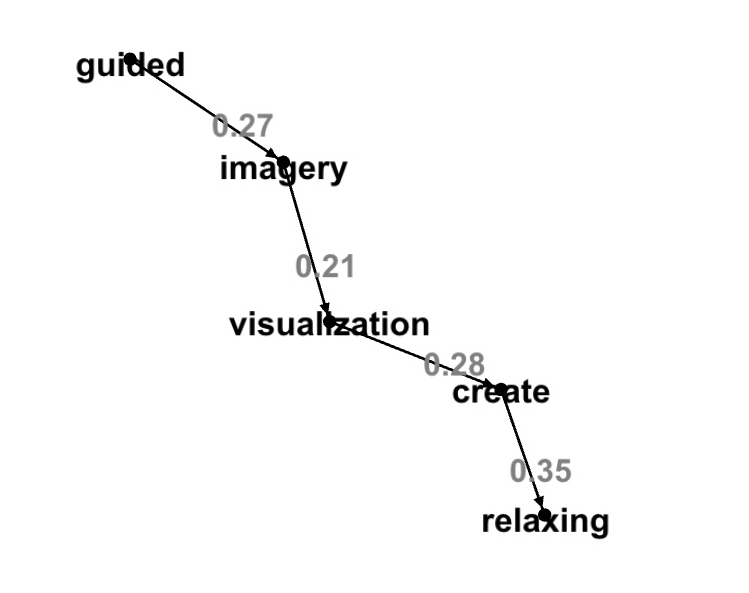
Graph DOT lines with no thresholds:
val resultDot2=component2dot(result,68719476739L,-1.0,1.0)

display(resultDot2)
"imagery" -> "visualization" [label="0.21"];
"create" -> "relaxing" [label="0.35"];
"create" -> "pressure" [label="0.01"];
"guided" -> "imagery" [label="0.27"];
"events" -> "create" [label="0.05"];
"visualization" -> "create" [label="0.28"];
"relaxing" -> "state" [label="-0.18"];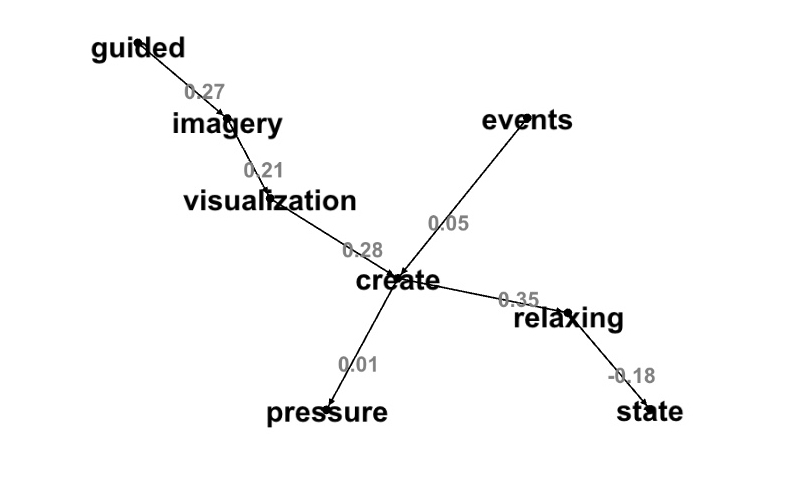
Here a other topics that gives us more ideas about stress relieve. We run 'component2dot' with no cosine similarity thresholds:
val resultDot3=component2dot(result,549755813891L,-1.0,1.0)

display(resultDot3)
"laughter" -> "humor" [label="0.45"];
"laughter" -> "relieve" [label="0.3"];
"drastically" -> "children" [label="-0.24"];
"minutes" -> "laughter" [label="0.12"];
"children" -> "relatively" [label="0.04"];
"studies" -> "laughter" [label="-0.03"];
"children" -> "laughter" [label="0.26"];
"relieve" -> "stress" [label="0.47"];
"stress" -> "minutes" [label="-0.15"];
"coping" -> "laughter" [label="0.45"];
"hospitalized" -> "children" [label="0.31"];
"importance" -> "laughter" [label="0.09"];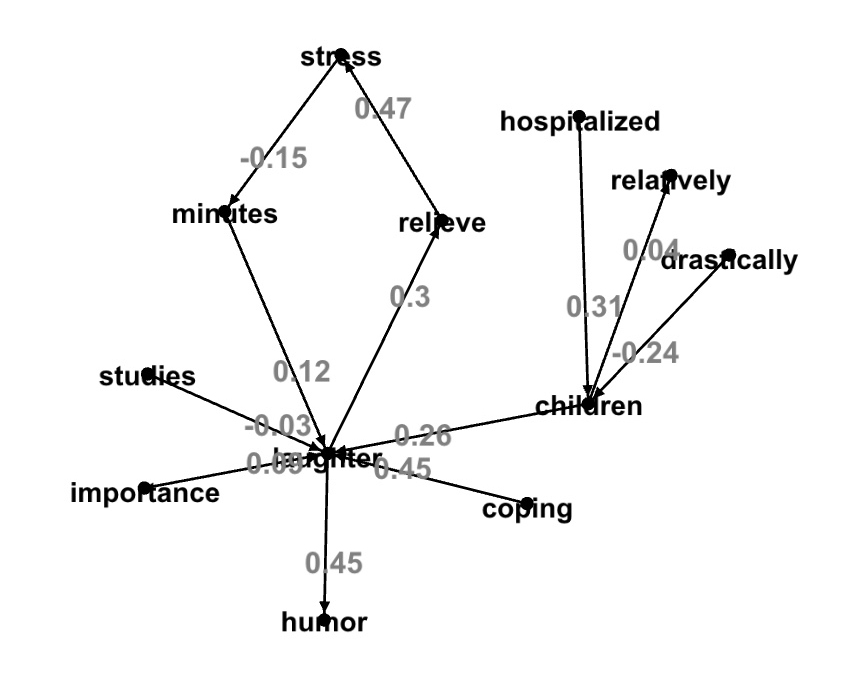
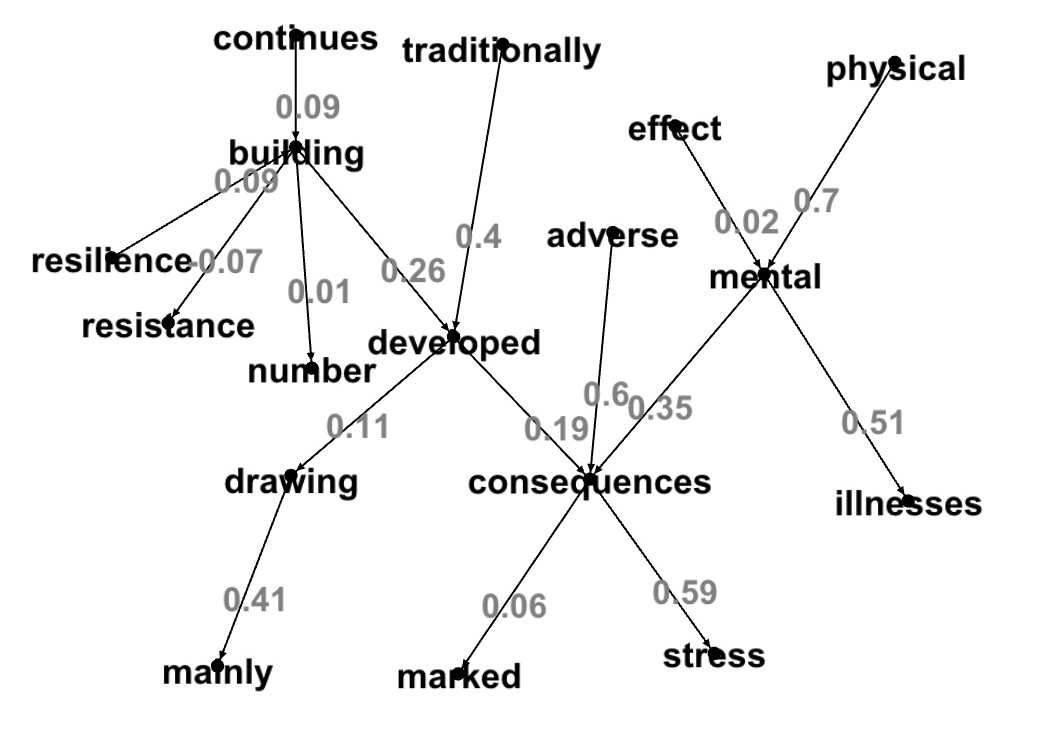
val resultDot4=component2dot(result,206158430208L,-1.0,1.0)

display(resultDot4)
"resilience" -> "building" [label="0.09"];
"adverse" -> "consequences" [label="0.6"];
"consequences" -> "marked" [label="0.06"];
"physical" -> "mental" [label="0.7"];
"drawing" -> "mainly" [label="0.41"];
"mental" -> "illnesses" [label="0.51"];
"continues" -> "building" [label="0.09"];
"building" -> "number" [label="0.01"];
"consequences" -> "stress" [label="0.59"];
"effect" -> "mental" [label="0.02"];
"traditionally" -> "developed" [label="0.4"];
"building" -> "resistance" [label="-0.07"];
"building" -> "developed" [label="0.26"];
"mental" -> "consequences" [label="0.35"];
"developed" -> "consequences" [label="0.19"];
"developed" -> "drawing" [label="0.11"];