Semantic Similarity Is Not Evidence
Large language models are very good at turning text into compact semantic representations. That strength is exactly why embeddings have become such a common foundation for search, recommendation, retrieval, matching, and ranking. In many tasks, that is enough. But this small research experiment highlights an important boundary case: some systems depend not only on what entities say, but on how they are connected.
In many tasks, correctness depends not only on what entities say, but on how they are connected. Two items can sound close in language and still not belong together in the way the system actually cares about. And the reverse can also happen: two items may not look very similar in text, yet still be strongly connected through behavior, session context, or other observed relationships.
This post is about making that gap visible.
Instead of asking only whether two items look similar in language, we compare two representation spaces: a text-only embedding baseline and a relationship-aware embedding space built from the same text vectors, but refined through graph learning over an evidence graph. This is not meant as a new production recommender. It is a small, concrete research example meant to illustrate a broader concept: there are settings in which text-only similarity, even when powered by strong language models, is not the same thing as evidence.
The central idea is simple: even strong semantic similarity is not always the same thing as evidence. If your system depends on interactions, constraints, or relationship structure, then text-only similarity can feel persuasive while still being structurally wrong. Relationship-aware diagnostics make that difference measurable.
For readers who want to go beyond the article, we’ve also made the Relationship Metrics Starter Kit available as a notebook-based reference implementation that carries the full idea and architecture of the method into a form that can be inspected, tested, and extended. In the era of AI coding, that matters: the notebook is not just something to run, but a transparent handoff layer for the workflow itself, making it easier to transfer the method into new datasets, environments, and business contexts with the help of coding agents.
Pay what you want, starting at $0.
View the Starter KitIntroduction
LLM-based systems are extremely effective when the signal really is in the text. Summarization, semantic search, question answering, and many classification tasks fit that pattern well. In those settings, a dense semantic representation often captures most of what matters.
But not every problem is truly linguistic.
In many real-world systems, what makes a connection valid is relational rather than descriptive. A pair of entities may share vocabulary, topic, or tone and still not belong together in the way the system needs. On the other hand, two entities may have weak textual overlap but still be strongly tied by interaction history, shared users, session behavior, or some other kind of evidence.
That distinction matters far beyond recommendation. It matters in retrieval pipelines, matching systems, decision support, graph-enhanced AI, and any environment where people may start treating a high similarity score as if it were enough to justify a downstream connection.
So the real question is not whether LLMs are useful. Of course they are. The real question is whether they capture the kind of relationship your task actually depends on.
We like to frame this as a data quality question for AI systems. Instead of arguing abstractly about whether LLM-only systems are sufficient, we can ask something much more practical: does semantic similarity behave like real support in this setting, or does relational evidence change what should count as correct?
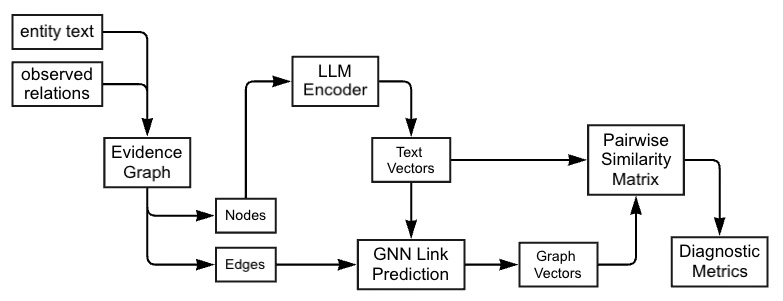
Figure 1. The diagnostic pipeline. Text and observed interactions are combined into an evidence graph, which supports two representation pathways: a text-only path and a relationship-aware path. Their resulting similarity spaces are then compared using the same metrics.
Methods
The setup is intentionally simple. Each item has text, and the system also has observed relationships. In this study, the observed relationships come from user interactions with news articles. In this case, the “relationships” are not manually defined semantics; they are observed interaction links induced from co-click behavior. That gives us two complementary kinds of signal.
Textual signal: what the article title and summary say.
Relational signal: what user behavior suggests about which items are actually connected.
The starting point is a bipartite user-item graph. From that, we build an item-item co-click graph: if the same user clicked two items on the same day, those items are treated as behaviorally linked. That induced co-click graph becomes the relational scaffold for the relationship-aware pathway.
We then compare two representation spaces built over exactly the same items.
-
Text-only baseline. Each news item is encoded independently with the
all-MiniLM-L6-v2sentence-transformers model, producing a 384-dimensional embedding. This gives a clean semantic baseline from language alone. - Relationship-aware representation. The same text embeddings are used as input features for a GraphSAGE model trained with a link-prediction objective on the co-click graph. Importantly, the downstream analysis does not use raw link predictions. Instead, it uses the model’s pre-final node embeddings. That keeps the comparison focused on representation quality rather than classifier output.
Once both spaces are built, cosine similarity is computed for item pairs in each space. Those similarity scores are then evaluated on the same labeled pair set, where positives are co-click edges and negatives are non-edges. Holding the items, pair labels, and similarity function fixed makes the comparison clean: the main difference is whether relational structure was allowed to reshape the geometry of the space.
The diagnostics are deliberately interpretable.
- Edge recovery (ROC AUC): if similarity is used as a score, how well does it distinguish true interaction-supported edges from non-edges?
- Distribution separation (Cohen’s d): how far apart are the similarity distributions for edges and non-edges?
- Top-quantile concentration (Lift@q): among the most similar pairs, how concentrated are the true edges relative to the overall edge rate?
These metrics answer slightly different versions of the same practical question: does “similar” really mean “supported”?
Experiments
This post uses a small, focused experiment to illustrate the idea rather than to cover every possible scenario. The goal is not to optimize a production recommender system. The goal is to test whether adding behavioral relationships changes the similarity space in ways that text-only embeddings do not capture on their own.
Dataset and day-level slice
The data source for this experiment is the Microsoft News Dataset (MIND), using the MINDsmall training split. To keep the analysis easy to inspect and easy to explain, We restrict the study to a single day: 2019-11-11.
Only the two raw tables needed for this diagnostic setup are used:
news.tsv, which provides article identifiers, categories, and text fieldsbehaviors.tsv, which records user impressions and click histories
This day-level slice serves as a compact, self-contained snapshot for the experiment. It provides the text needed to build the text-only baseline and the interaction data needed to construct behavioral relationships, making it possible to compare the two representation pathways on the same set of news items.
Dataset page: MIND: Microsoft News Dataset.
Behavioral relationship graph
From the filtered behaviors.tsv and news.tsv records for 2019-11-11, we build a day-specific bipartite user-item interaction graph. Because the diagnostics in this post are computed on item pairs, that bipartite graph is then projected onto the item side to form an item-item co-click graph.
In practical terms, if the same user clicked two news items on the same day, those two items are treated as behaviorally linked. These co-click links define the positive item pairs. Pairs of items without a co-click link are treated as negative pairs for evaluation.
To make sure each retained user contributes pairwise signal, we keep only users with at least two clicks that day. After filtering, the retained day-level data contains:
- 10,656 users
- 22,157 impressions
- 37,435 clicks
- 27,945 unique news items observed in the filtered logs
From this filtered interaction data, the induced co-click graph used for representation learning and diagnostics contains:
- 1,991 graph nodes (news items)
- 40,637 graph edges (co-click relationships)
Although many items appear in the logs, only the 1,991 items that participate in at least one co-click relationship are included in the induced graph. All representation learning and diagnostics are restricted to this item set.
Representations compared
The experiment compares two representation pathways over exactly the same news items.
-
Text-only baseline. Each news item is encoded independently with the
all-MiniLM-L6-v2sentence-transformers model, producing a 384-dimensional embedding. This gives a clean semantic baseline from language alone. - Relationship-aware representation. The same text embeddings are used as input features for a GraphSAGE model trained with a link-prediction objective on the induced co-click graph. Importantly, the downstream analysis does not use the model’s raw link predictions. Instead, it uses the model’s pre-final node embeddings, which incorporate both text features and interaction-derived relational context.
For both representation spaces, cosine similarity is computed over item pairs and evaluated using the same diagnostic metrics. That keeps the comparison focused on the question that matters here: what changes when relationship structure is allowed to reshape the embedding space?
Reported diagnostics
The results show a clear and useful pattern.
Edge recovery. Relationship-aware embeddings achieve much higher ROC AUC than text-only embeddings, reaching about 0.75 compared with about 0.52 for the text-only baseline. In this experiment, the relationship-aware space is much better aligned with true interaction-supported edges.
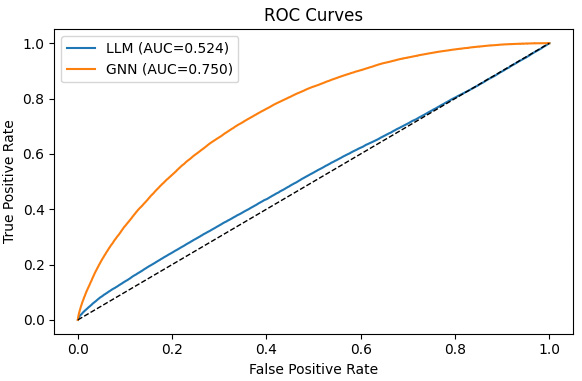
Figure 2. ROC curves for predicting co-click edges from cosine similarity. The relationship-aware space reaches an AUC of about 0.75, while the text-only space stays near 0.52, close to chance.
Edge vs. non-edge separation. The same story appears in the similarity distributions. In the text-only space, edge and non-edge pairs overlap heavily. In the relationship-aware space, the two groups separate much more clearly, which means the representation is doing a better job of aligning similarity with evidence-supported structure.
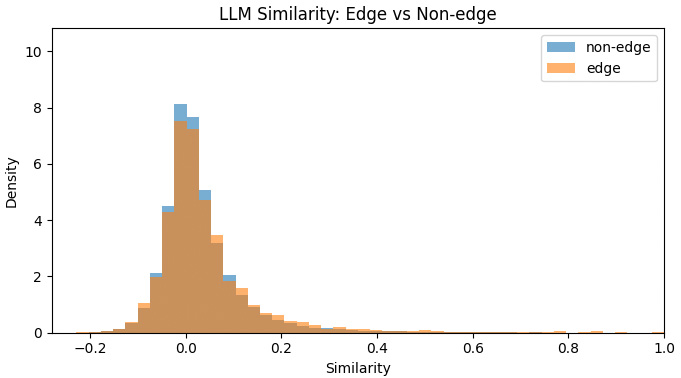
Figure 3. Text-only similarity distributions for edge and non-edge pairs. The overlap is substantial, which means language-only similarity provides weak separation between linked and unlinked pairs.
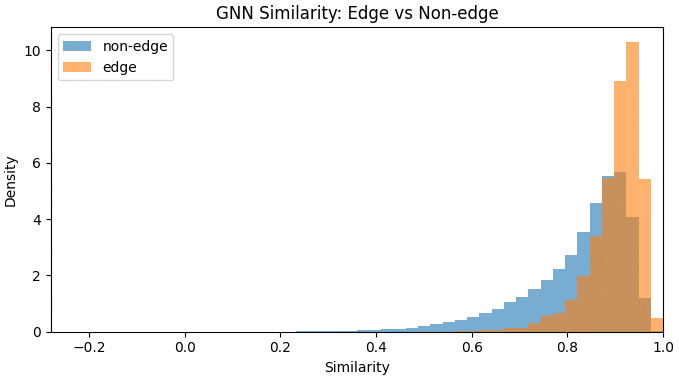
Figure 4. Relationship-aware similarity distributions for edge and non-edge pairs. The separation is much clearer, indicating stronger alignment with interaction-supported structure.
Top-quantile concentration. The pattern also holds where many real systems care most: the top of the ranking. Among the highest-similarity pairs, the relationship-aware space is much more enriched with true co-click edges than the text-only baseline.
| Top fraction q | Edge rate (Text-only) | Edge rate (Relationship-aware) | Lift improvement |
|---|---|---|---|
| 0.001 (0.1%) | 0.099 | 0.217 | 2.19× |
| 0.005 (0.5%) | 0.064 | 0.147 | 2.30× |
| 0.010 (1%) | 0.050 | 0.125 | 2.48× |
| 0.050 (5%) | 0.034 | 0.084 | 2.46× |
At the top 1% of most similar pairs, the relationship-aware space produces an edge rate of 0.125 versus 0.050 for the text-only baseline. In other words, the very top of the relationship-aware similarity ranking is about two and a half times better aligned with true co-click links.
So the point here is not that LLMs are weak. LLMs are already very strong. The point is that there are real scenarios where LLM-only is weaker than LLM + GNN. This experiment shows one compact example of that pattern in a form that is easy to inspect, reuse, and adapt.
The disagreement examples are just as interesting as the aggregate metrics. Rather than keeping long academic tables, it is easier to think of them as two recurring failure modes.
Outlier analysis
To make the disagreement between semantic similarity and relationship-aware similarity more concrete, we also looked at outlier pairs where the two measures strongly diverge. These are not a separate metric. They are qualitative examples that help show what the diagnostic results mean in practice.
The goal is to surface pairs where one representation says “these two items are very similar,” while the other says “not really.” That gives a more interpretable view of the same distinction already visible in the ROC curves, distribution plots, and Lift@q results.
We consider two symmetric outlier types using fixed percentile thresholds.
- High text similarity, low relationship-aware similarity. These are pairs in the top 1% of text-only similarity scores but the bottom 50% of relationship-aware similarity scores.
- High relationship-aware similarity, low text similarity. These are pairs in the top 1% of relationship-aware similarity scores but the bottom 50% of text-only similarity scores.
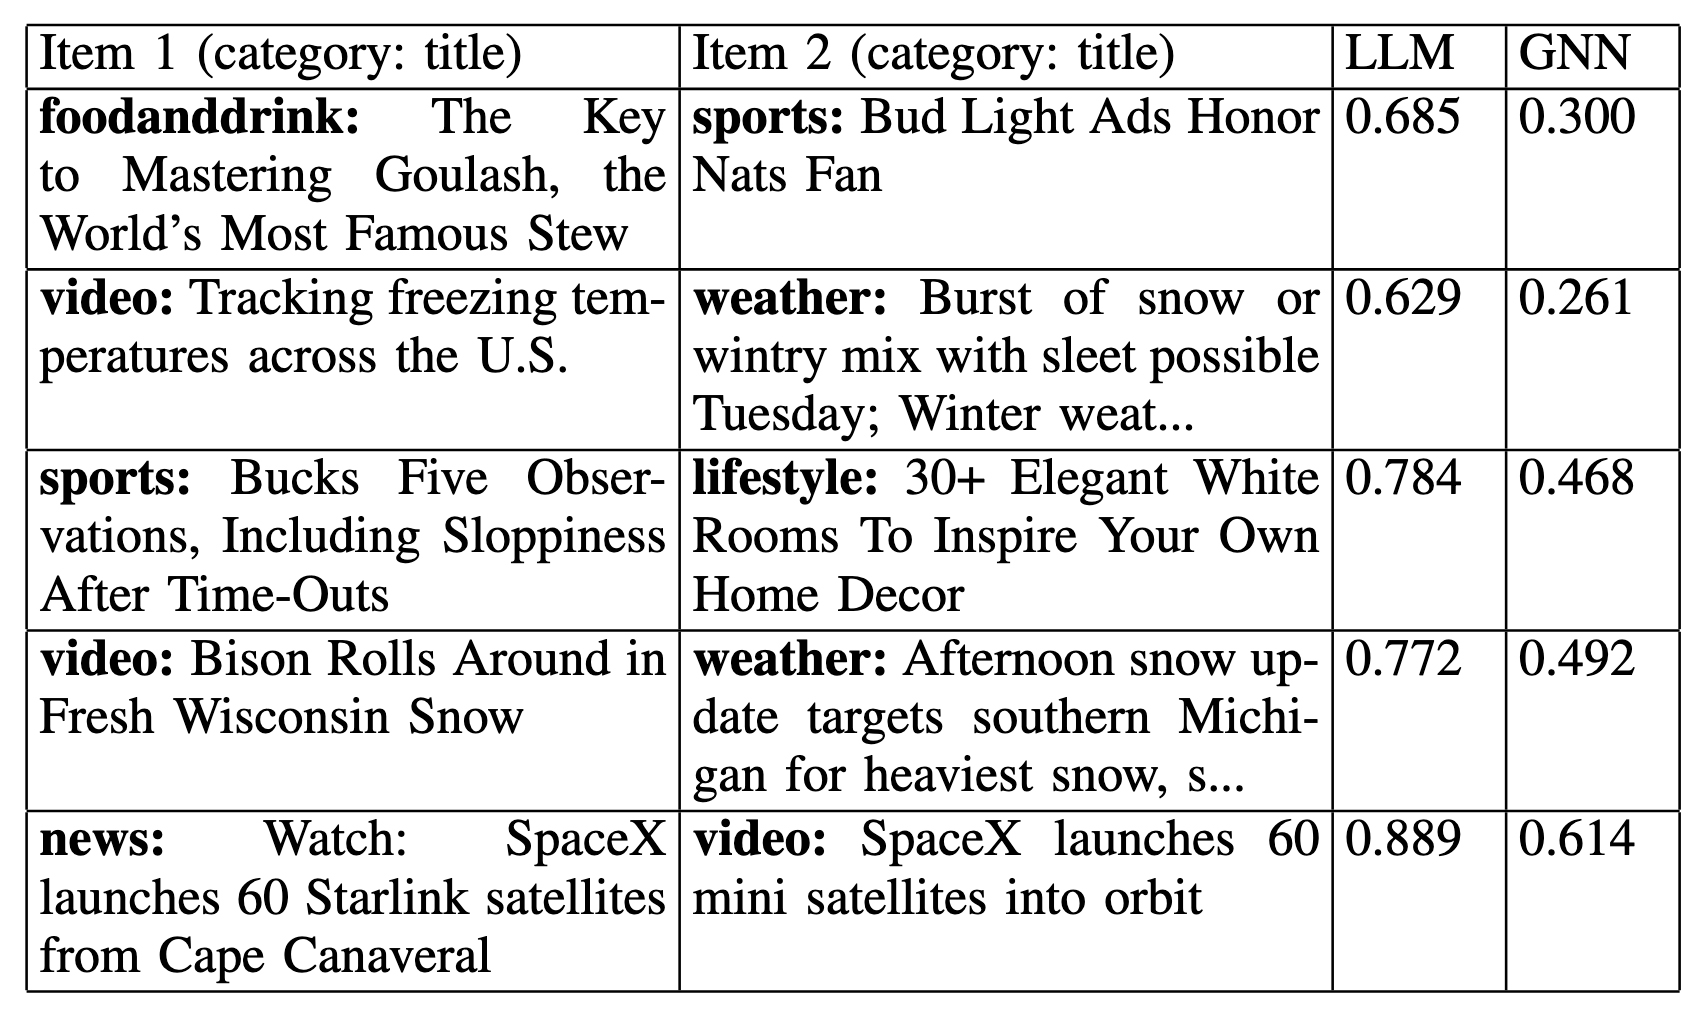
To make the examples more informative, we restrict the analysis to cross-category pairs and rank candidates by the size of the disagreement. That helps emphasize structural effects rather than trivial cases where two items look similar simply because they share obvious vocabulary or belong to the same narrow topical bucket.
These two outlier groups reveal complementary patterns.
The first group — text-high, structure-low — captures pairs that look convincing in language but are not strongly supported by observed interaction structure. A representative example is the pair “Watch: SpaceX launches 60 Starlink satellites from Cape Canaveral” and “SpaceX launches 60 mini satellites into orbit”. The text-only similarity is extremely high, which makes intuitive sense, but the relationship-aware score is noticeably lower. In other words, semantic resemblance alone does not guarantee the kind of evidence-supported link captured by user behavior.
The second group — structure-high, text-low — captures the opposite case: pairs that are weakly expressed, or even absent, in language but become strongly connected once interaction structure is taken into account. One example is “Underwater camera captures swimming tigers” paired with “Barham Fire: Crews gain control of Hollywood Hills brush fire...”. Here the text-only similarity is strongly negative, while the relationship-aware similarity is very high. That does not mean the pair is intuitively similar in language. It means the evidence graph is capturing a relationship signal that text alone does not express.
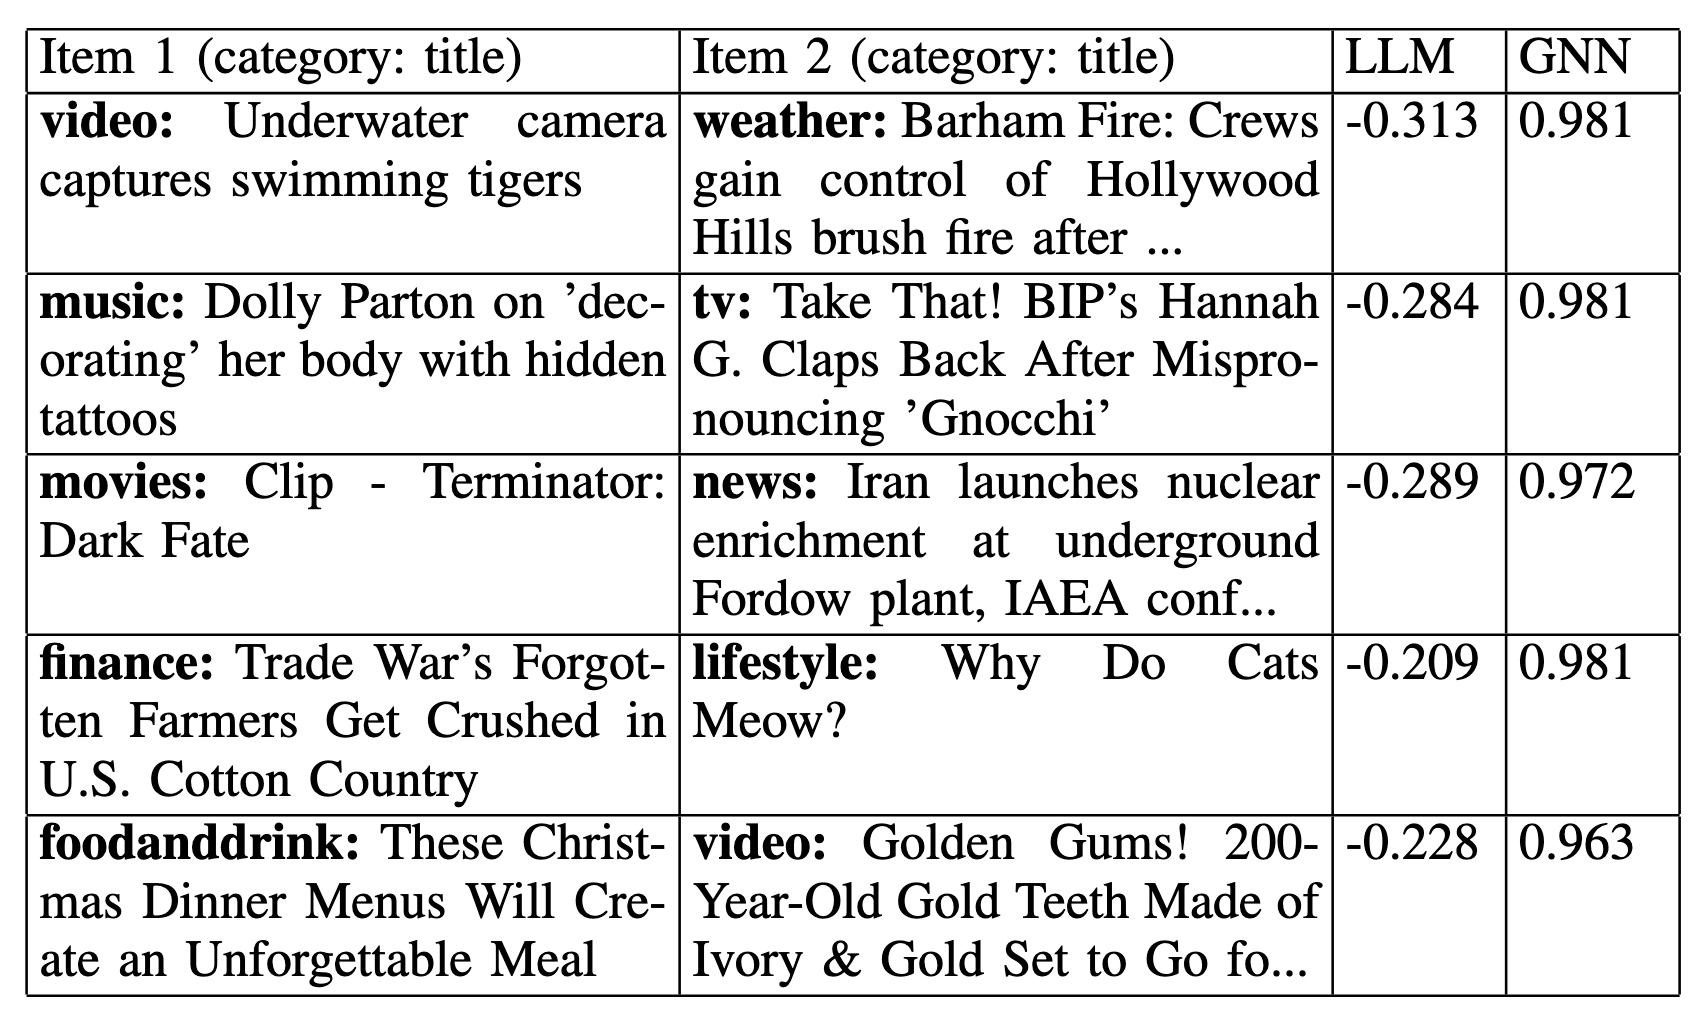
Taken together, these outliers make the broader point easier to see. Semantic similarity can be plausible without being evidence-supported, and evidence-supported links can be nearly invisible to text alone. That is exactly the distinction the diagnostic framework is meant to surface.
Conclusion
The main takeaway is not that LLMs are failing. LLMs are already extremely capable, and in many tasks they may be entirely sufficient. The takeaway is that semantic similarity should not automatically be treated as evidence.
This small research experiment shows one concrete case where LLM-only performs worse than LLM + GNN. That does not mean every problem needs graph learning. It means the boundary is testable.
That is the value of the concept presented here. It gives practitioners a simple way to ask a better question: not whether LLMs are good in general, but whether text-only similarity is enough for the specific relationship their task depends on.
This blog illustrates the idea with one compact example, not all possible scenarios. The same diagnostic idea can be adapted to other datasets, other domains, other evidence graphs, and other language models.
Soon we will also share the notebook so readers can reuse the pattern, modify it, and hand it to AI coding tools such as Codex or Opus to reimplement in another environment. The broader lesson is not tied to one specific model. You can take the same idea and test it with other LLMs, other embedding pipelines, and other graph-learning setups. The conceptual question remains the same: when is LLM-only enough, and when does adding relationship structure produce a better representation?
Try the Relationship Metrics Starter Kit
This post used a compact sample dataset to make the method easy to inspect. The next step is practical: take a dataset you care about, represent it as nodes and edges, and run the notebook. The goal is to test, early and concretely, whether relationship-aware diagnostics reveal meaningful signal beyond text-only similarity in your own setting.
The kit is designed not only for hands-on testing, but also for idea and architecture transfer. It provides a transparent workflow that can be inspected step by step and then adapted with AI coding tools for new data, environments, and business contexts.
It includes:
- notebook
- sample nodes-and-edges dataset
- README
- data dictionary
- example results
Pay what you want, starting at $0.
Download the Starter Kit